Go directly to any of the following sections:
The legal professions major at Widener is not ranked on College Factual’s Best Colleges and Universities for Legal Professions. This could be for a number of reasons, such as not having enough data on the major or school to make an accurate assessment of its quality.
During the 2021-2022 academic year, Widener University handed out 12 bachelor's degrees in legal professions. This is an increase of 71% over the previous year when 7 degrees were handed out.
In 2022, 19 students received their master’s degree in legal professions from Widener. This makes it the #90 most popular school for legal professions master’s degree candidates in the country.
In addition, 288 students received their doctoral degrees in legal professions in 2022, making the school the #22 most popular school in the United States for this category of students.
In 2022-2023, the average part-time undergraduate tuition at Widener was $1,753 per credit hour for both in-state and out-of-state students. The average full-time tuition and fees for undergraduates are shown in the table below.
| In State | Out of State | |
|---|---|---|
| Tuition | $52,598 | $52,598 |
| Fees | $1,040 | $1,040 |
| Books and Supplies | $1,408 | $1,408 |
| On Campus Room and Board | $15,530 | $15,530 |
| On Campus Other Expenses | $1,890 | $1,890 |
Learn more about Widener tuition and fees.
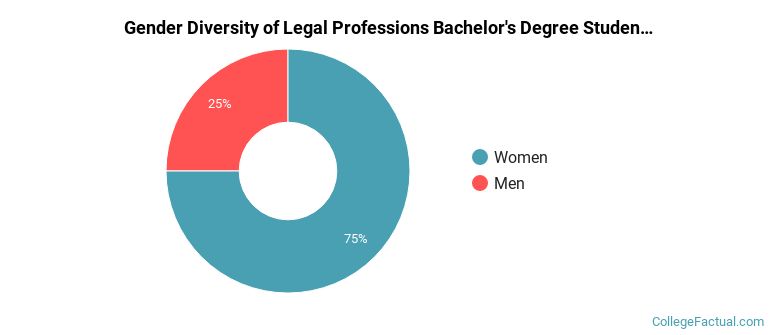
During the 2021-2022 academic year, 12 students graduated with a bachelor's degree in legal professions from Widener. About 25% were men and 75% were women.
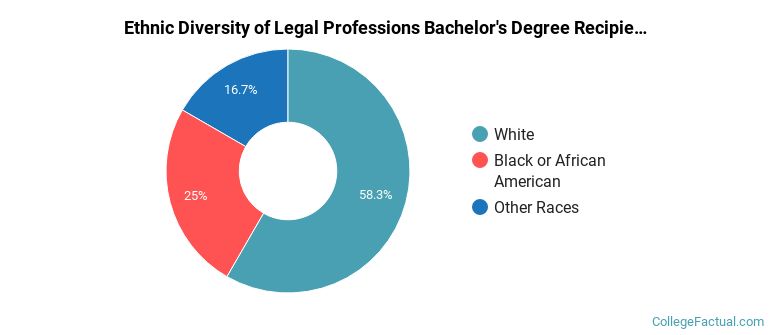
The majority of the students with this major are white. About 58% of 2022 graduates were in this category.
The following table and chart show the ethnic background for students who recently graduated from Widener University with a bachelor's in legal professions.
| Ethnic Background | Number of Students |
|---|---|
| Asian | 0 |
| Black or African American | 3 |
| Hispanic or Latino | 0 |
| White | 7 |
| Non-Resident Aliens | 0 |
| Other Races | 2 |
Online degrees for the Widener legal professions bachelor’s degree program are not available at this time. To see if the school offers distance learning options in other areas, visit the Widener Online Learning page.
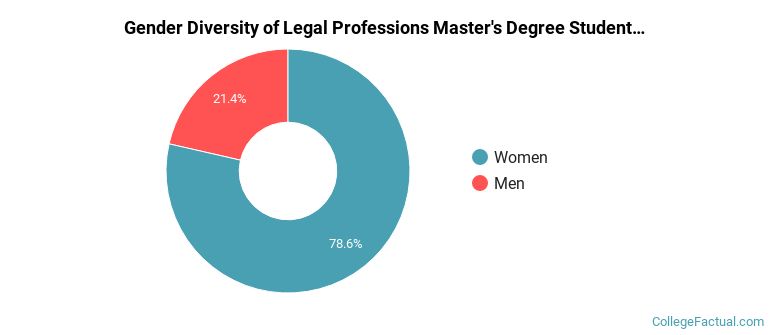
In the 2021-2022 academic year, 28 students earned a master's degree in legal professions from Widener. About 79% of these graduates were women and the other 21% were men.
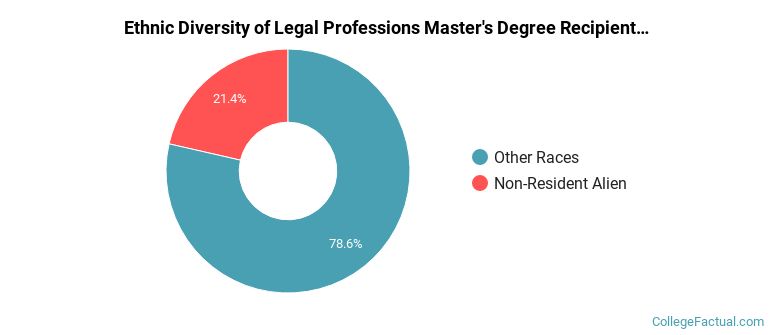
The following table and chart show the ethnic background for students who recently graduated from Widener University with a master's in legal professions.
| Ethnic Background | Number of Students |
|---|---|
| Asian | 0 |
| Black or African American | 0 |
| Hispanic or Latino | 0 |
| White | 0 |
| Non-Resident Aliens | 6 |
| Other Races | 22 |
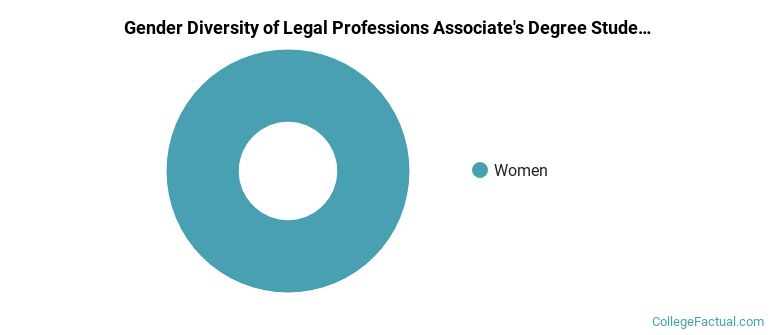
All of the 2 students who graduated with a Associate’s in legal professions from Widener in 2022 were women.
The following table and chart show the ethnic background for students who recently graduated from Widener University with a associate's in legal professions.
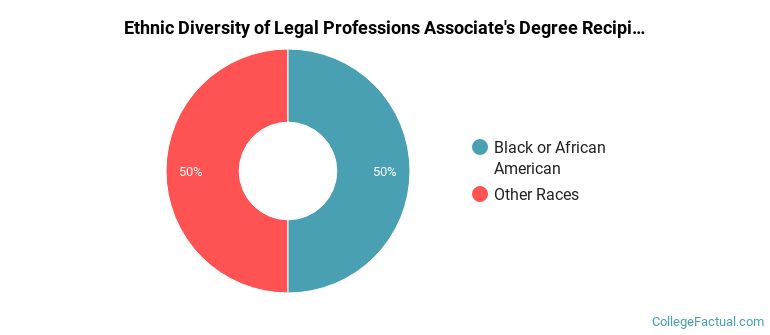
| Ethnic Background | Number of Students |
|---|---|
| Asian | 0 |
| Black or African American | 1 |
| Hispanic or Latino | 0 |
| White | 0 |
| Non-Resident Aliens | 0 |
| Other Races | 1 |
Take a look at the following statistics related to the make-up of the legal professions majors at Widener University.
Legal Professions students may decide to major in one of the following focus areas. Individual majors may not be available for all degree levels.
| Major | Annual Graduates |
|---|---|
| Law | 281 |
| Legal Research | 45 |
| Legal Support Services | 32 |
| Related Major | Annual Graduates |
|---|---|
| Homeland Security, Law Enforcement & Firefighting | 31 |
More about our data sources and methodologies.