Here, you'll find out more about the major, including such details as the number of graduates, what degree levels are offered, ethnicity of students, average salaries, and more. Also, learn how YVC ranks among other schools offering degrees in business administration.
Jump to any of the following sections:
The bachelor's program at YVC was ranked #1,295 on College Factual's Best Schools for business administration list. It is also ranked #24 in Washington.
During the 2021-2022 academic year, Yakima Valley College handed out 23 bachelor's degrees in business administration & management. This is an increase of 10% over the previous year when 21 degrees were handed out.
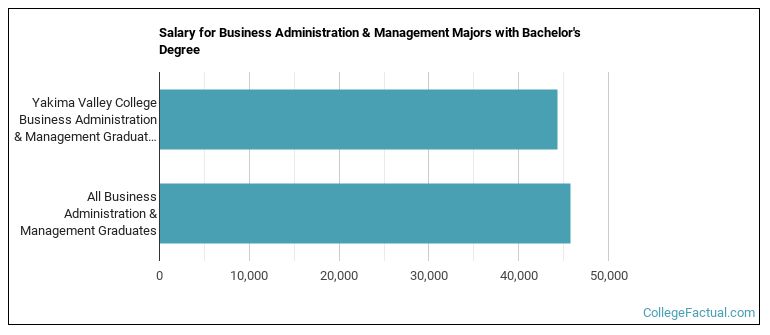
Business Administration majors who earn their bachelor's degree from YVC go on to jobs where they make a median salary of $44,370 a year. This is less than $45,741, which is the national median of all business administration majors in the nation who earn bachelor's degrees.
In 2022-2023, the average part-time undergraduate tuition at YVC was $141 per credit hour for out-of-state students. The average for in-state students was $124 per credit hour. The average full-time tuition and fees for undergraduates are shown in the table below.
| In State | Out of State | |
|---|---|---|
| Tuition | $4,623 | $5,157 |
| Fees | $540 | $540 |
| Books and Supplies | $762 | $762 |
| On Campus Room and Board | $9,363 | $9,363 |
| On Campus Other Expenses | $3,750 | $3,750 |
Learn more about YVC tuition and fees.
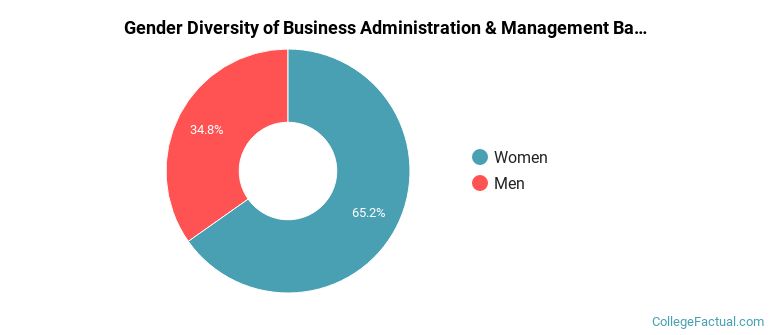
During the 2021-2022 academic year, 23 students graduated with a bachelor's degree in business administration from YVC. About 35% were men and 65% were women.
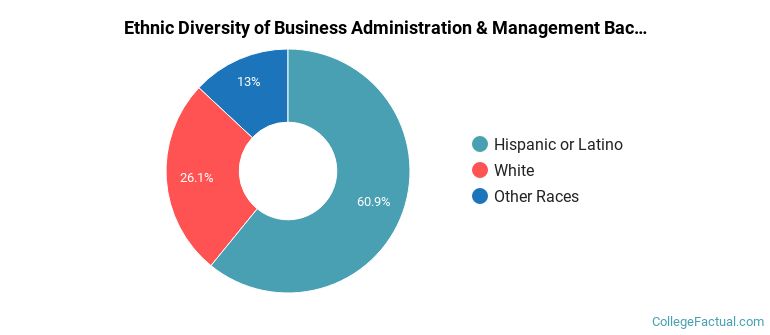
The majority of the bachelor's degree graduates for this major are Hispanic or Latino. In the most recent graduating class for which data is available, 61% of grads fell into this category.
The following table and chart show the ethnic background for students who recently graduated from Yakima Valley College with a bachelor's in business administration.
| Ethnic Background | Number of Students |
|---|---|
| Asian | 0 |
| Black or African American | 0 |
| Hispanic or Latino | 14 |
| White | 6 |
| Non-Resident Aliens | 0 |
| Other Races | 3 |
Online degrees for the YVC business administration bachelor’s degree program are not available at this time. To see if the school offers distance learning options in other areas, visit the YVC Online Learning page.
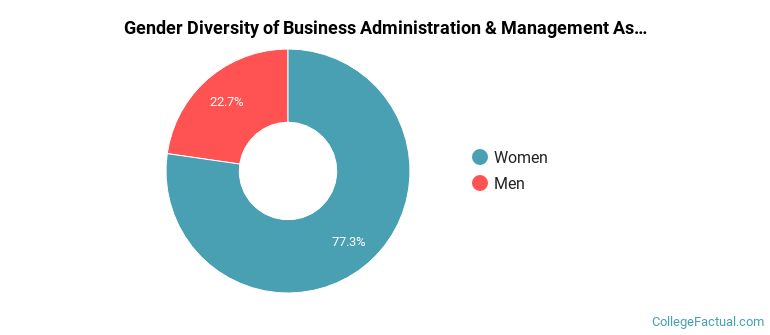
During the 2021-2022 academic year, 22 students graduated with a associate's degree in business administration from YVC. About 23% were men and 77% were women.
The following table and chart show the ethnic background for students who recently graduated from Yakima Valley College with a associate's in business administration.
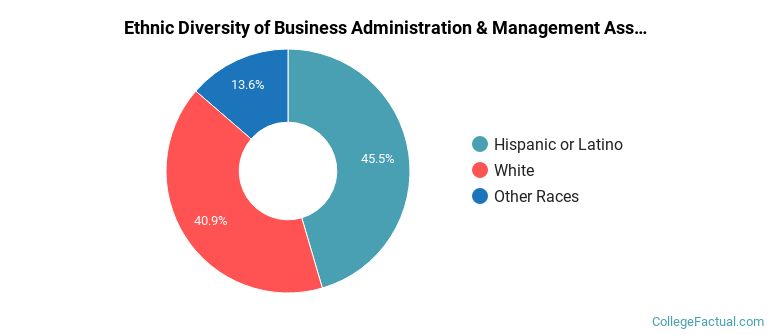
| Ethnic Background | Number of Students |
|---|---|
| Asian | 0 |
| Black or African American | 0 |
| Hispanic or Latino | 10 |
| White | 9 |
| Non-Resident Aliens | 0 |
| Other Races | 3 |
Take a look at the following statistics related to the make-up of the business administration majors at Yakima Valley College.
| Related Major | Annual Graduates |
|---|---|
| General Business/Commerce | 30 |
| Accounting | 12 |
| Business Support & Assistant Services | 8 |
| Marketing | 2 |
| Entrepreneurial Studies | 1 |
View All Business Administration & Management Related Majors >