College Factual analyzes over 2,000 colleges and universities in its annual rankings and ranks them in a variety of ways, including most diverse, best overall quality, best for non-traditional students, and much more.
Zane State College was awarded 2 badges in the 2025 rankings. The highest ranked major at the school is criminal justice studies.
Explore the best ranked schools for the programs you are most interested in.
Zane State College landed the #1,858 spot in College Factual's 2025 ranking of best overall colleges in the United States. The higher ed experts analyzed 2,152 colleges and universities across the nation to determine this ranking.
Zane State College also holds the #79 spot on the Best Colleges in Ohio ranking.
Returning adults and other non-traditional students may appreciate the fact that Zane State College has an open admissions policy. This means that you'll only have to submit basic materials, which may include proof that you completed high school or an equivalent program.
With a student to faculty ratio of 15 to 1, Zane State College is about average in this regard as the nationwide rate is 15 to 1. While this does not translate directly to class size, it's a good indicator of how much time professors will have to spend with their students on a one-on-one basis.
Another measure that is often used to estimate how much access students will have to their professors is how many faculty members are full-time. The idea here is that part-time faculty tend to spend less time on campus, so they may not be as available to students as full-timers.
The full-time faculty percentage at Zane State College is 36%. This is lower than the national average of 47%.
During the 2017-2018 academic year, there were 2,223 undergraduates at Zane State College with 687 being full-time and 1,536 being part-time.
| $0-30 K | $30K-48K | $48-75 | $75-110K | $110K + |
|---|---|---|---|---|
| $5,784 | $7,174 | $9,399 | $11,254 | $10,868 |
The net price is calculated by adding tuition, room, board and other costs and subtracting financial aid.Note that the net price is typically less than the published for a school. For more information on the sticker price of Zane State College, see our tuition and fees and room and board pages.
It's not uncommon for college students to take out loans to pay for school. In fact, almost 66% of students nationwide depend at least partially on loans. At Zane State College, approximately 27% of students took out student loans averaging $3,852 a year. That adds up to $15,408 over four years for those students.
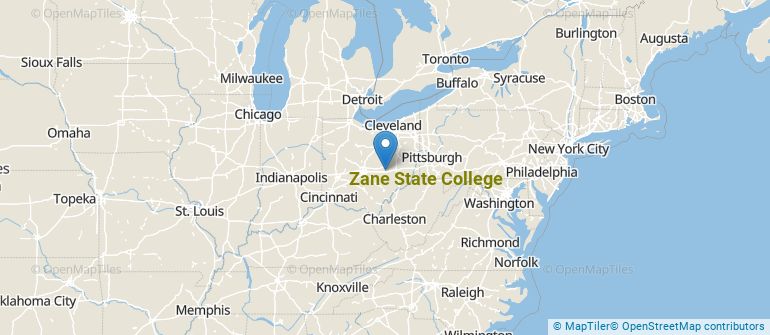
Get more details about the location of Zane State College.
Contact details for Zane State College are given below.
| Contact Details | |
|---|---|
| Address: | 1555 Newark Rd, Zanesville, OH 43701-2626 |
| Phone: | 740-588-5000 |
| Website: | www.zanestate.edu/ |
| Most Popular Majors | Bachelor’s Degrees | Average Salary of Graduates |
|---|---|---|
| Business Administration & Management | 56 | NA |
| Liberal Arts General Studies | 56 | NA |
| Electronics Engineering Technology | 47 | NA |
| Allied Health & Medical Assisting Services | 37 | NA |
| Real Estate | 29 | NA |
| Criminal Justice & Corrections | 22 | NA |
| Information Science | 19 | NA |
| Wildlife Management | 16 | NA |
| Accounting | 14 | NA |
| General Education | 10 | NA |
Online learning is becoming popular at even the oldest colleges and universities in the United States. Not only are online classes great for returning adults with busy schedules, they are also frequented by a growing number of traditional students.
In 2022-2023, 895 students took at least one online class at Zane State College. This is a decrease from the 1,001 students who took online classes the previous year.
| Year | Took at Least One Online Class | Took All Classes Online |
|---|---|---|
| 2022-2023 | 895 | 251 |
| 2021-2022 | 1,001 | 297 |
| 2020-2021 | 1,071 | 287 |
| 2018-2019 | 760 | 153 |
Footnotes
*The racial-ethnic minorities count is calculated by taking the total number of students and subtracting white students, international students, and students whose race/ethnicity was unknown. This number is then divided by the total number of students at the school to obtain the racial-ethnic minorities percentage.
References
More about our data sources and methodologies.