Social Work is a concentration offered under the social work major at California State University - Dominguez Hills. Here, you’ll find out more about the major master’s degree program in social work, including such details as the number of graduates, diversity of students, and more.
You can jump to any section of this page using the links below:
The following table shows the average full-time tuition and fees for graduate student.
| In State | Out of State | |
|---|---|---|
| Tuition | $7,176 | $16,680 |
| Fees | $1,204 | $1,204 |
Online degrees for the CSUDH social work master’s degree program are not available at this time. To see if the school offers distance learning options in other areas, visit the CSUDH Online Learning page.
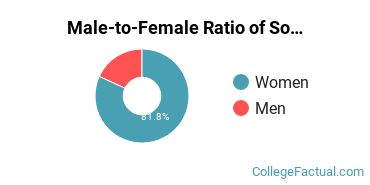
Of the students who received their master’s degree in social work in 2019-2020, 81.8% of them were women. This is less than the nationwide number of 87.2%.
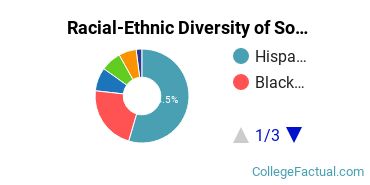
Racial-ethnic minority graduates* made up 88.9% of the social work master’s degrees at CSUDH in 2019-2020. This is higher than the nationwide number of 42%.
| Race/Ethnicity | Number of Students |
|---|---|
| Asian | 8 |
| Black or African American | 22 |
| Hispanic or Latino | 54 |
| Native American or Alaska Native | 0 |
| Native Hawaiian or Pacific Islander | 0 |
| White | 7 |
| International Students | 2 |
| Other Races/Ethnicities | 6 |
*The racial-ethnic minorities count is calculated by taking the total number of students and subtracting white students, international students, and students whose race/ethnicity was unknown. This number is then divided by the total number of students at the school to obtain the racial-ethnic minorities percentage.
More about our data sources and methodologies.