Business, Management & Marketing is a program of study at Capella University. The school offers a doctor’s degree in the area. We’ve pulled together some essential information you should know about the doctor’s degree program in business, management and marketing, including how many students graduate each year, the ethnic diversity of these students, and more.
You can jump to any section of this page using the links below:
In 2019-2020, the average part-time graduate tuition at Capella University was $547 per credit hour for both in-state and out-of-state students. Information about average full-time graduate student tuition and fees is shown in the table below.
| In State | Out of State | |
|---|---|---|
| Tuition | $14,767 | $14,767 |
If you’re one of the many students who want the flexibility of distance learning courses, you’ll be happy to hear that Capella University offers online option in its business, management and marketing doctor’s degree program. To see if the school offers distance learning options in other areas, visit the Capella University Online Learning page.
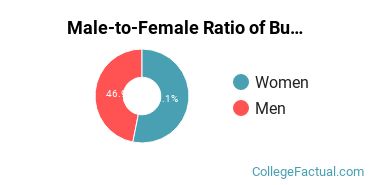
Of the students who received their doctor’s degree in business, management and marketing in 2019-2020, 53.1% of them were women. This is higher than the nationwide number of 45.7%.
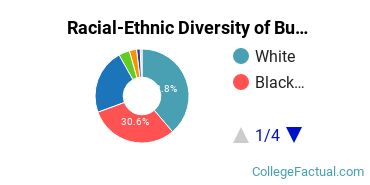
Of those graduates who received a doctor’s degree in business, management and marketing at Capella University in 2019-2020, 38.1% were racial-ethnic minorities*. This is higher than the nationwide number of 32%.
| Race/Ethnicity | Number of Students |
|---|---|
| Asian | 0 |
| Black or African American | 49 |
| Hispanic or Latino | 4 |
| Native American or Alaska Native | 2 |
| Native Hawaiian or Pacific Islander | 1 |
| White | 62 |
| International Students | 6 |
| Other Races/Ethnicities | 36 |
Business, Management & Marketing students may decide to major in one of the following focus areas.
| Focus Area | Annual Graduates |
|---|---|
| General Business/Commerce | 4 |
| Business Administration & Management | 110 |
| Accounting | 11 |
| Finance & Financial Management | 7 |
| Human Resource Management | 15 |
*The racial-ethnic minorities count is calculated by taking the total number of students and subtracting white students, international students, and students whose race/ethnicity was unknown. This number is then divided by the total number of students at the school to obtain the racial-ethnic minorities percentage.
More about our data sources and methodologies.