Finance is a concentration offered under the finance and financial management major at Capella University. We’ve gathered data and other essential information about the doctor’s degree program in finance, such as if the program is offered online, ethnicity of students, how many students graduated in recent times, and more.
You can jump to any section of this page using the links below:
During the 2019-2020 academic year, part-time graduate students at Capella University paid an average of $0 per credit hour. No discount was available for in-state students. The average full-time tuition and fees for graduate students are shown in the table below.
| In State | Out of State | |
|---|---|---|
| Tuition | $14,767 | $14,767 |
Learn about other programs related to <nil> that might interest you.
Managing and quantifying money is at the heart of the online bachelor's degree in finance at SNHU. You'll learn the fundamentals of investments, address key managerial issues, examine ethics from every angle and build the skillset to be a player in the multidimensional business marketplace.
Prepare to advance your current career in finance with Southern New Hampshire University's online Master's in Finance degree program.
If you’re one of the many students who want the flexibility of distance learning courses, you’ll be happy to hear that Capella University offers online option in its finance doctor’s degree program. To see if the school offers distance learning options in other areas, visit the Capella University Online Learning page.
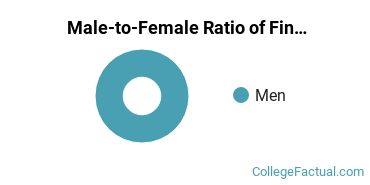
Of the students who received their doctor’s degree in finance in 2019-2020, 42.9% of them were women. This is about the same as the countrywide number of 41.4%.
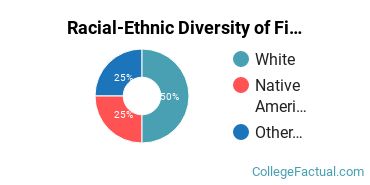
Racial-ethnic minority graduates* made up 71.4% of the finance doctor’s degrees at Capella University in 2019-2020. This is higher than the nationwide number of 17%.
| Race/Ethnicity | Number of Students |
|---|---|
| Asian | 0 |
| Black or African American | 4 |
| Hispanic or Latino | 0 |
| Native American or Alaska Native | 1 |
| Native Hawaiian or Pacific Islander | 0 |
| White | 2 |
| International Students | 0 |
| Other Races/Ethnicities | 0 |
*The racial-ethnic minorities count is calculated by taking the total number of students and subtracting white students, international students, and students whose race/ethnicity was unknown. This number is then divided by the total number of students at the school to obtain the racial-ethnic minorities percentage.
More about our data sources and methodologies.
