Criminal Justice Studies is a concentration offered under the criminal justice and corrections major at Capella University. Here, you’ll find out more about the major doctor’s degree program in criminal justice studies, including such details as the number of graduates, diversity of students, and more.
You can jump to any section of this page using the links below:
During the 2019-2020 academic year, part-time graduate students at Capella University paid an average of $0 per credit hour. No discount was available for in-state students. The average full-time tuition and fees for graduate students are shown in the table below.
| In State | Out of State | |
|---|---|---|
| Tuition | $14,767 | $14,767 |
If you’re one of the many students who want the flexibility of distance learning courses, you’ll be happy to hear that Capella University offers online option in its criminal justice studies doctor’s degree program. To see if the school offers distance learning options in other areas, visit the Capella University Online Learning page.
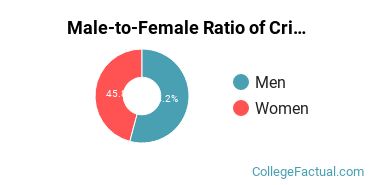
Of the students who received their doctor’s degree in criminal justice studies in 2019-2020, 45.8% of them were women. This is less than the nationwide number of 58.9%.
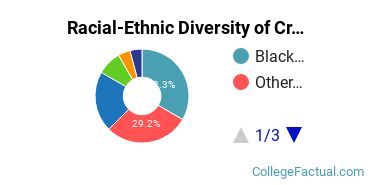
Of those graduates who received a doctor’s degree in criminal justice studies at Capella University in 2019-2020, 50.0% were racial-ethnic minorities*. This is higher than the nationwide number of 26%.
| Race/Ethnicity | Number of Students |
|---|---|
| Asian | 0 |
| Black or African American | 8 |
| Hispanic or Latino | 1 |
| Native American or Alaska Native | 2 |
| Native Hawaiian or Pacific Islander | 1 |
| White | 5 |
| International Students | 0 |
| Other Races/Ethnicities | 7 |
*The racial-ethnic minorities count is calculated by taking the total number of students and subtracting white students, international students, and students whose race/ethnicity was unknown. This number is then divided by the total number of students at the school to obtain the racial-ethnic minorities percentage.
More about our data sources and methodologies.