Other Social Sciences is a concentration offered under the other social sciences major at Capella University. Here, you’ll find out more about the major doctor’s degree program in other social sciences, including such details as the number of graduates, ethnicity of students, related majors and concentrations, and more.
You can jump to any section of this page using the links below:
Learn about start dates, transferring credits, availability of financial aid, and more by contacting the universities below.
Learn to analyze social factors and become an advocate for individual and community health with this online bachelor's from Southern New Hampshire University.
Part-time graduates at Capella University paid an average of $547 per credit hour in 2019-2020. This tuition was the same for both in-state and out-of-state students. The average full-time tuition and fees for graduate students are shown in the table below.
| In State | Out of State | |
|---|---|---|
| Tuition | $14,767 | $14,767 |
If you’re interested in online learning, you’re in luck. Capella University does offer online classes in its other social sciences doctor’s degree program. To see if the school offers distance learning options in other areas, visit the Capella University Online Learning page.
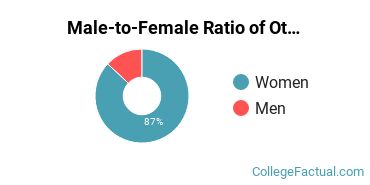
Women made up around 73.0% of the other social sciences students who took home a doctor’s degree in 2019-2020. This is higher than the nationwide number of 62.7%.
Of those graduates who received a doctor’s degree in other social sciences at Capella University in 2019-2020, 59.5% were racial-ethnic minorities*. This is higher than the nationwide number of 39%.
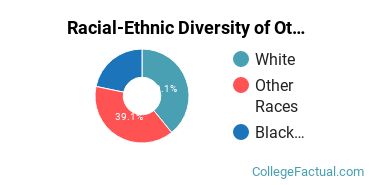
| Race/Ethnicity | Number of Students |
|---|---|
| Asian | 1 |
| Black or African American | 16 |
| Hispanic or Latino | 4 |
| Native American or Alaska Native | 1 |
| Native Hawaiian or Pacific Islander | 0 |
| White | 8 |
| International Students | 0 |
| Other Races/Ethnicities | 7 |
*The racial-ethnic minorities count is calculated by taking the total number of students and subtracting white students, international students, and students whose race/ethnicity was unknown. This number is then divided by the total number of students at the school to obtain the racial-ethnic minorities percentage.
More about our data sources and methodologies.
