Organizational Behavior Studies is a concentration offered under the human resource management major at Capella University. Here, you’ll find out more about the major master’s degree program in organizational behavior studies, including such details as the number of graduates, diversity of students, and more.
If there’s something special you’re looking for, you can use one of the links below to find it:
Part-time graduates at Capella University paid an average of $547 per credit hour in 2019-2020. This tuition was the same for both in-state and out-of-state students. Information about average full-time graduate student tuition and fees is shown in the table below.
| In State | Out of State | |
|---|---|---|
| Tuition | $14,767 | $14,767 |
If you’re one of the many students who want the flexibility of distance learning courses, you’ll be happy to hear that Capella University offers online option in its organizational behavior studies master’s degree program. To see if the school offers distance learning options in other areas, visit the Capella University Online Learning page.
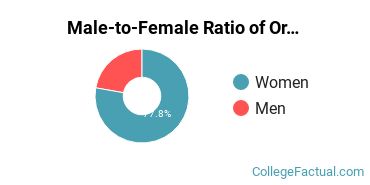
Women made up around 92.9% of the organizational behavior studies students who took home a master’s degree in 2019-2020. This is higher than the nationwide number of 62.9%.
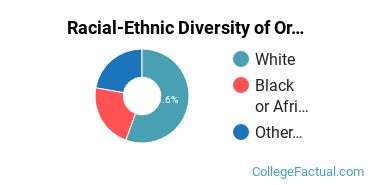
Of those graduates who received a master’s degree in organizational behavior studies at Capella University in 2019-2020, 14.3% were racial-ethnic minorities*. This is lower than the nationwide number of 40%.
| Race/Ethnicity | Number of Students |
|---|---|
| Asian | 0 |
| Black or African American | 2 |
| Hispanic or Latino | 0 |
| Native American or Alaska Native | 0 |
| Native Hawaiian or Pacific Islander | 0 |
| White | 8 |
| International Students | 0 |
| Other Races/Ethnicities | 4 |
You may also be interested in one of these majors related to organizational behavior studies.
| Related Major | Annual Graduates |
|---|---|
| General Human Resources Management/Personnel Administration | 246 |
View All Organizational Behavior Studies Related Majors >
*The racial-ethnic minorities count is calculated by taking the total number of students and subtracting white students, international students, and students whose race/ethnicity was unknown. This number is then divided by the total number of students at the school to obtain the racial-ethnic minorities percentage.
More about our data sources and methodologies.