General Psychology is a concentration offered under the general psychology major at Capella University. We’ve pulled together some essential information you should know about the master’s degree program in psychology, including how many students graduate each year, the ethnic diversity of these students, whether or not the degree is offered online, and more.
You can jump to any section of this page using the links below:
Part-time graduates at Capella University paid an average of $547 per credit hour in 2019-2020. This tuition was the same for both in-state and out-of-state students. The average full-time tuition and fees for graduate students are shown in the table below.
| In State | Out of State | |
|---|---|---|
| Tuition | $14,767 | $14,767 |
Looking for online learning options? Good news, you can take online classes in the psychology master’s degree program at Capella University. To see if the school offers distance learning options in other areas, visit the Capella University Online Learning page.
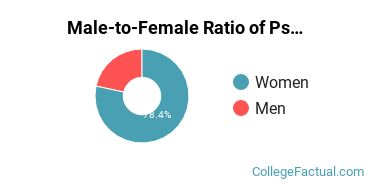
Of the students who received their master’s degree in psychology in 2019-2020, 78.7% of them were women. This is about the same as the countrywide number of 77.0%.
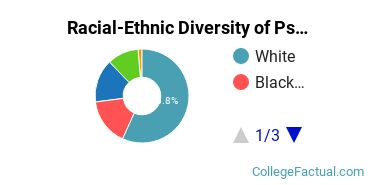
Racial-ethnic minority graduates* made up 37.2% of the psychology master’s degrees at Capella University in 2019-2020. This is higher than the nationwide number of 34%.
| Race/Ethnicity | Number of Students |
|---|---|
| Asian | 1 |
| Black or African American | 18 |
| Hispanic or Latino | 14 |
| Native American or Alaska Native | 1 |
| Native Hawaiian or Pacific Islander | 0 |
| White | 46 |
| International Students | 2 |
| Other Races/Ethnicities | 12 |
*The racial-ethnic minorities count is calculated by taking the total number of students and subtracting white students, international students, and students whose race/ethnicity was unknown. This number is then divided by the total number of students at the school to obtain the racial-ethnic minorities percentage.
More about our data sources and methodologies.