College Factual produces its Best Quality Schools rankings on a yearly basis to recognize those graduate schools that provide an excellent educational experience and are dedicated to helping their students succeed. Our methodology places a high weight on things such as post-graduation wages, time to graduate, and student-per-faculty ratio. Post-graduation debt, faculty and staff diversity, and other factors are also taken into account.
In College Factual's 2024 ranking of the Best Master's Degree Schools in the U.S., Caribbean University - Ponce landed the #1145 spot out of the 1149 schools analyzed for this list.
Caribbean University - Ponce also ranked #17 for Best Master's Degree Schools in Puerto Rico.
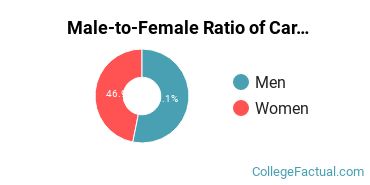
Athough the male-female ratio may vary depending on the degree program, 46.9% of the total graduate students at Caribbean University - Ponce are women and 53.1% are men.
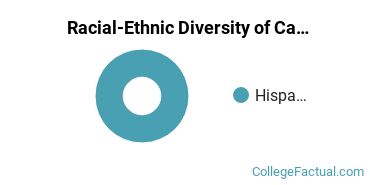
Of all the graduate students at Caribbean University - Ponce, around 100.0% belong to a racial-ethnic minority group. For more details on graduate school diversity at the school, check out the chart below. If you click on it, you'll be taken to a page with more details.
The average tuition and fees for graduate students is shown below.
| In-State | Out-of-State | |
|---|---|---|
| Tuition | $5,115 | $5,115 |
| Fees | $1,052 | $1,052 |
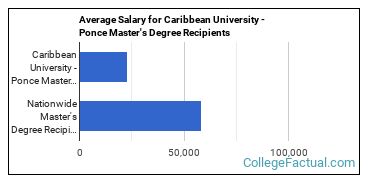
Graduate students earning a master's degree from Caribbean University - Ponce enter careers with an average starting salary of $22,782. When comparing to other master's degree holders, that's on the low side. It's about 61% lower than the national average of $58,425.
Get more details about the location of Caribbean University - Ponce.

Contact details for Caribbean University - Ponce are given below.
| Contact Details | |
|---|---|
| Address: | Ave. Ednita Nazario #1015, Ponce, PR 00716-7733 |
| Phone: | 787-840-2955 |
| Website: | www.caribbean.edu/ |
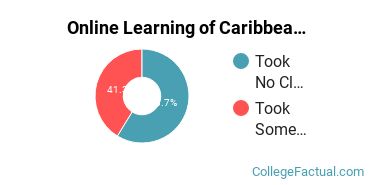
In 2020-2021, 100.0% of the graduate students at Caribbean University - Ponce took at least one class online.
The only degree programs listed here are those in which master’s degrees were awarded in 2020-2021.
| Master’s Degree Program | Annual Graduates |
|---|---|
| Curriculum & Instruction | 7 |
| Educational Administration | 6 |
| Human Resource Management | 1 |
| Instructional Media Design | 1 |
| Special Education | 12 |
Footnotes
*The racial-ethnic minorities count is calculated by taking the total number of students and subtracting white students, international students, and students whose race/ethnicity was unknown. This number is then divided by the total number of students at the school to obtain the racial-ethnic minorities percentage.
References
More about our data sources and methodologies.