If you want to know more about Cornell College Graduate School, such as what degree programs it offers, how diverse it is, how well it ranks, and more, this is your one-stop resource. Use the following list to jump to the section on the page with details on that topic.
Cornell College is not ranked in our 2024 overall quality rankings. This could be for a number of reasons, including lack of data.
Cornell College Graduate Student Diversity
3Graduate Students
66.7%Women
33.3%Racial-Ethnic Minorities*
For the last year in which we have data, 3 graduate students decided that Cornell College was the best place for them. College Factual looked at the demographics of these students to determine how diverse the population is. Our findings are below.
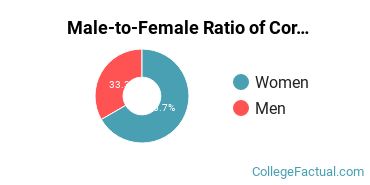
Cornell College Graduate Student Male-Female Ratio
The total graduate student population at Cornell College is made up of 66.7% women and 33.3% men. Note that these percentages may differ for certain degree programs.
Cornell College Graduate Student Racial-Ethnic Diversity
Of all the graduate students at Cornell College, around 33.3% belong to a racial-ethnic minority group. The following chart shows the distribution of racial-ethnic groups at the school. If you click on it, you'll find more detailed information.
Cornell College Graduate School Cost of Attendance
$15,050Avg Tuition & Fees (In-State)
At Cornell College, part-time graduate students pay $2,700 per credit hour, whether they are from in-state or out-of-state.
The average graduate full-time tuition and fees is shown in the table below.
Cornell College is a private not-for-profit institution situated in Mount Vernon, Iowa. The charming, small-town atmosphere of Mount Vernon draws many to the area.
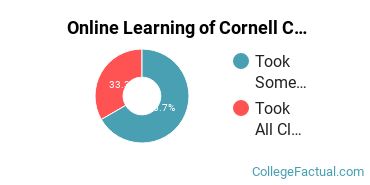
In 2020-2021, 66.7% of the graduate students at Cornell College took at least one class online.
Notes and References
Footnotes
*The racial-ethnic minorities count is calculated by taking the total number of students and subtracting white students, international students, and students whose race/ethnicity was unknown. This number is then divided by the total number of students at the school to obtain the racial-ethnic minorities percentage.