The main focus area for this major is General History. For more details on this concentration, visit its profile page.
History is a major offered under the history program of study at Queens College. We’ve gathered data and other essential information about the master’s degree program in history, such as if the program is offered online, ethnicity of students, how many students graduated in recent times, and more.
If there’s something special you’re looking for, you can use one of the links below to find it:
In 2019-2020, the average part-time graduate tuition at QC was $855 per credit hour for out-of-state students. The average for in-state students was $470 per credit hour. The average full-time tuition and fees for graduate students are shown in the table below.
| In State | Out of State | |
|---|---|---|
| Tuition | $11,090 | $20,520 |
| Fees | $522 | $522 |
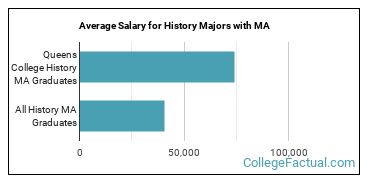
history who receive their master’s degree from QC make an average of $73,949 a year during the early days of their career. That is 82% higher than the national average of $40,606.
QC does not offer an online option for its history master’s degree program at this time. To see if the school offers distance learning options in other areas, visit the QC Online Learning page.
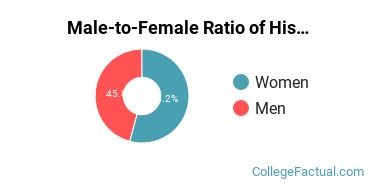
Of the students who received their master’s degree in history in 2019-2020, 54.2% of them were women. This is higher than the nationwide number of 46.6%.
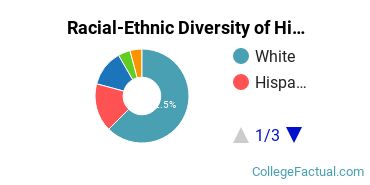
Racial-ethnic minority graduates* made up 33.3% of the history master’s degrees at QC in 2019-2020. This is higher than the nationwide number of 18%.
| Race/Ethnicity | Number of Students |
|---|---|
| Asian | 1 |
| Black or African American | 3 |
| Hispanic or Latino | 4 |
| Native American or Alaska Native | 0 |
| Native Hawaiian or Pacific Islander | 0 |
| White | 15 |
| International Students | 1 |
| Other Races/Ethnicities | 0 |
History students may decide to major in one of the following focus areas.
| Focus Area | Annual Graduates |
|---|---|
| General History | 24 |
*The racial-ethnic minorities count is calculated by taking the total number of students and subtracting white students, international students, and students whose race/ethnicity was unknown. This number is then divided by the total number of students at the school to obtain the racial-ethnic minorities percentage.
More about our data sources and methodologies.