Here is an overview of the graduate program in education at Mercer University. You can earn it at the Master’s, Doctoral, Professional Certificate levels, with undergraduate study also available. At its best it places at #6 out of 26 schools (Master’s level) by College Factual. Jump to any of the following sections:
College Factual rates Mercer University among the top schools in the country for education, placing at #593 out of 1,675 schools nationally.
| Ranking | Rank |
|---|---|
| Best Education Schools | 593 of 1,675 |
| Best Education Schools in Georgia | 8 of 56 |
| Best Education Schools in the Southeast Region | 75 of 410 |
The following degree levels are available for education at Mercer University, along with how many graduates complete each level annually.
| Degree Level | Annual Graduates |
|---|---|
| Bachelor’s | 91 |
| Master’s | 220 |
| Doctoral | 13 |
| Professional Certificate | 59 |
This education area of study at Mercer University breaks down into these majors. Choose a major for its full rankings, popularity, and outcomes:
For the most recent IPEDS reporting year, Mercer University conferred 220 master’s degrees in education.
Mercer University ranks competitively among schools offering education at the master’s level. In particular it placed #6 out of 26 schools by College Factual.
| Ranking | Rank |
|---|---|
| Best Education Master’s Degree Schools in Georgia | 6 |
| Best Education Master’s Degree Schools in the Southeast Region | 44 |
| Best Education Master’s Degree Schools | 389 |
Average full-time graduate tuition and fees are listed in the table below.
| In State | Out of State | |
|---|---|---|
| Tuition | $43,688 | $43,688 |
| Fees | $300 | $300 |
Read more about Mercer University tuition and fees.
Among recent graduates, 20% of education master’s degrees went to men and 80% went to women.
 The largest share of education master’s degree graduates at Mercer University are Black or African American. About 58% of graduates fell into this category.
The following table and chart show the ethnic background for students who recently graduated from Mercer University with a master’s in education.
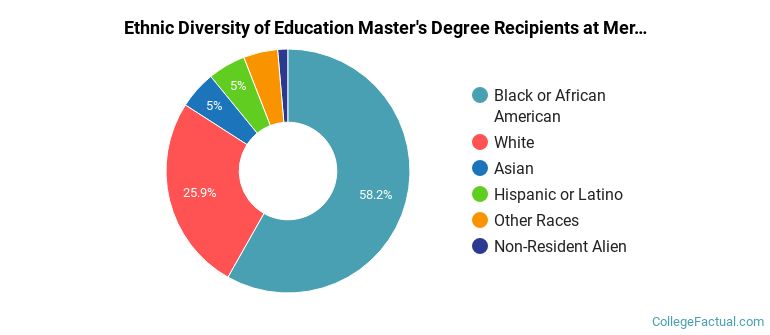
| Ethnic Background | Number of Students |
|---|---|
| Asian | 11 |
| Black or African American | 128 |
| Hispanic or Latino | 11 |
| White | 57 |
| Non-Resident Aliens | 3 |
| Other Races | 10 |
During the most recent reporting year, Mercer University awarded 13 doctoral degrees in education.
Mercer University is not currently ranked for education at the doctoral level.
Among recent graduates, 15% of education doctoral degrees went to men and 85% went to women.
 The majority of education doctoral degree graduates at Mercer University were Black or African American. Approximately 38% of graduates fell into this category.
The following table and chart show the ethnic background for students who recently graduated from Mercer University with a doctoral in education.
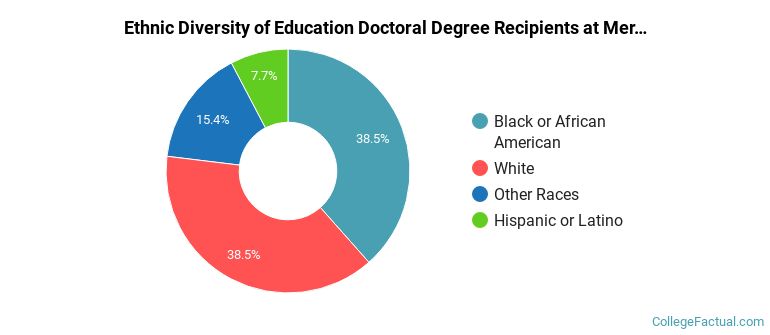
| Ethnic Background | Number of Students |
|---|---|
| Asian | 0 |
| Black or African American | 5 |
| Hispanic or Latino | 1 |
| White | 5 |
| Non-Resident Aliens | 0 |
| Other Races | 2 |
In the most recent year for which we have data, Mercer University handed out 59 professional certificate degrees in education.
Mercer University has not been ranked for education at the professional certificate level.
Among recent graduates, 12% of education professional certificate degrees went to men and 88% went to women.
 The majority of education professional certificate degree graduates at Mercer University were Black or African American. Roughly 56% of graduates fell into this category.
The following table and chart show the ethnic background for students who recently graduated from Mercer University with a professional certificate in education.
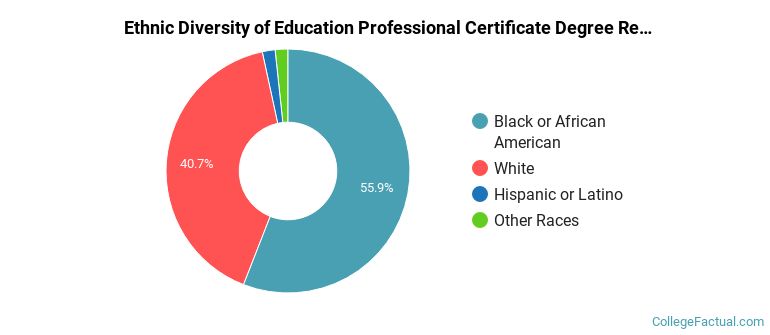
| Ethnic Background | Number of Students |
|---|---|
| Asian | 0 |
| Black or African American | 33 |
| Hispanic or Latino | 1 |
| White | 24 |
| Non-Resident Aliens | 0 |
| Other Races | 1 |
This field is also offered at the undergraduate level at Mercer University. Here are the undergraduate award levels offered.
| Undergraduate Level | Annual Graduates |
|---|---|
| Bachelor’s Degrees in Education | 91 |