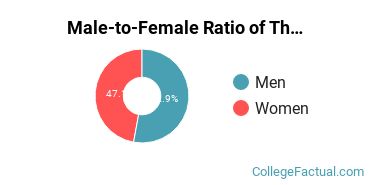
Women make up 47.1% of the total graduate student body at The New England Conservatory of Music while men make you 52.9%. These percentages may be different for specific degree programs.
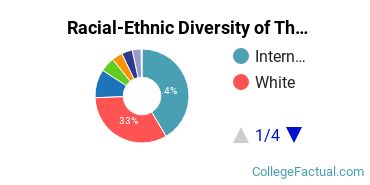
Of all the graduate students at The New England Conservatory of Music, around 21.9% belong to a racial-ethnic minority group. Americans aren't the only ones who appreciate the graduate programs at The New England Conservatory of Music. Around 41.4% of graduate students are international. The chart below shows the breakdown of graduate student demographics at the school. You can click on it for a more detailed view.
The average tuition and fees for graduate students is shown below.
| In-State | Out-of-State | |
|---|---|---|
| Tuition | $52,730 | $52,730 |
| Fees | $1,000 | $1,000 |
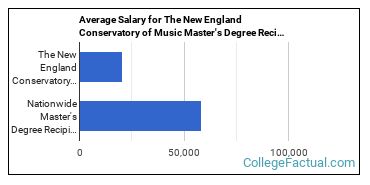
Master's degree recipients from The New England Conservatory of Music earn an average salary of $20,682 during the early years of their career. When comparing to other master's degree holders, that's on the low side. It's about 65% lower than the national average of $58,425.
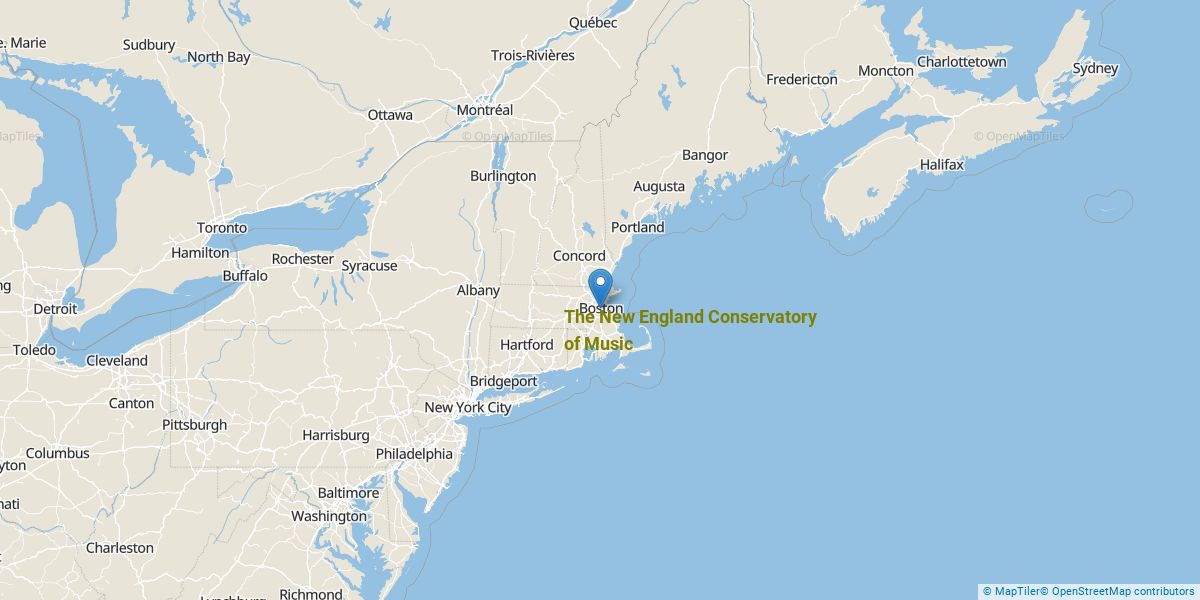
Get more details about the location of The New England Conservatory of Music.
Contact details for The New England Conservatory of Music are given below.
| Contact Details | |
|---|---|
| Address: | 290 Huntington Ave, Boston, MA 02115-5018 |
| Phone: | 617-585-1100 |
| Website: | https://necmusic.edu/ |
| Facebook: | http://www.facebook.com/necmusic |
| Twitter: | http://twitter.com/#!/necmusic |
During the 2020-2021 academic year, 8.7% of the graduate students at The New England Conservatory of Music took at least one online course.

The only degree programs listed here are those in which master’s degrees were awarded in 2020-2021.
| Master’s Degree Program | Annual Graduates |
|---|---|
| Music | 122 |
Just like the master’s degree programs, only programs that had doctorate degrees awarded in 2020-2021 are shown here.
| Doctorate Degree Program | Annual Graduates |
|---|---|
| Music | 6 |
Footnotes
*The racial-ethnic minorities count is calculated by taking the total number of students and subtracting white students, international students, and students whose race/ethnicity was unknown. This number is then divided by the total number of students at the school to obtain the racial-ethnic minorities percentage.
References
More about our data sources and methodologies.