General Health Services/Allied Health/Health Sciences is a concentration offered under the health sciences and services major at University of Colorado Denver/Anschutz Medical Campus. Here, you’ll find out more about the major doctor’s degree program in health studies, including such details as the number of graduates, ethnicity of students, related majors and concentrations, and more.
You can jump to any section of this page using the links below:
During the 2019-2020 academic year, part-time graduate students at CU Anschutz paid an average of $1,255 per credit hour if they came to the school from out-of-state. In-state students paid a discounted rate of $377 per credit hour. The following table shows the average full-time tuition and fees for graduate student.
| In State | Out of State | |
|---|---|---|
| Tuition | $6,786 | $22,590 |
| Fees | $1,325 | $1,325 |
Online degrees for the CU Anschutz health studies doctor’s degree program are not available at this time. To see if the school offers distance learning options in other areas, visit the CU Anschutz Online Learning page.
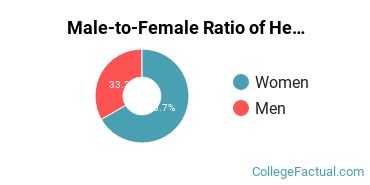
All of the students who received their Doctorate in health studies in 2019-2020 were women.
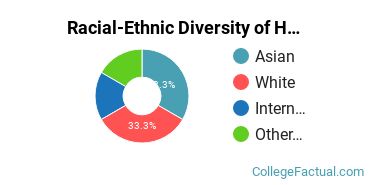
Around 50.0% of health studies doctor’s degree recipients at CU Anschutz in 2019-2020 were awarded to racial-ethnic minorities*. This is higher than the nationwide number of 38%.
| Race/Ethnicity | Number of Students |
|---|---|
| Asian | 1 |
| Black or African American | 0 |
| Hispanic or Latino | 1 |
| Native American or Alaska Native | 0 |
| Native Hawaiian or Pacific Islander | 0 |
| White | 2 |
| International Students | 0 |
| Other Races/Ethnicities | 0 |
*The racial-ethnic minorities count is calculated by taking the total number of students and subtracting white students, international students, and students whose race/ethnicity was unknown. This number is then divided by the total number of students at the school to obtain the racial-ethnic minorities percentage.
More about our data sources and methodologies.