Criminal Justice is a concentration offered under the criminal justice and corrections major at University of Colorado Denver/Anschutz Medical Campus. Here, you’ll find out more about the major master’s degree program in criminal justice, including such details as the number of graduates, diversity of students, and more.
If there’s something special you’re looking for, you can use one of the links below to find it:
Out-of-state part-time graduates at CU Anschutz paid an average of $1,255 per credit hour in 2019-2020. The average for in-state students was $377 per credit hour. The average full-time tuition and fees for graduate students are shown in the table below.
| In State | Out of State | |
|---|---|---|
| Tuition | $6,786 | $22,590 |
| Fees | $1,325 | $1,325 |
Looking for online learning options? Good news, you can take online classes in the criminal justice master’s degree program at CU Anschutz. To see if the school offers distance learning options in other areas, visit the CU Anschutz Online Learning page.
Of the students who received their master’s degree in criminal justice in 2019-2020, 84.6% of them were women. This is higher than the nationwide number of 52.4%.

Around 30.8% of criminal justice master’s degree recipients at CU Anschutz in 2019-2020 were awarded to racial-ethnic minorities*. This is lower than the nationwide number of 44%.
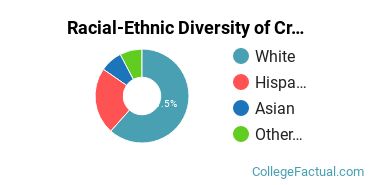
| Race/Ethnicity | Number of Students |
|---|---|
| Asian | 1 |
| Black or African American | 0 |
| Hispanic or Latino | 3 |
| Native American or Alaska Native | 0 |
| Native Hawaiian or Pacific Islander | 0 |
| White | 8 |
| International Students | 0 |
| Other Races/Ethnicities | 1 |
*The racial-ethnic minorities count is calculated by taking the total number of students and subtracting white students, international students, and students whose race/ethnicity was unknown. This number is then divided by the total number of students at the school to obtain the racial-ethnic minorities percentage.
More about our data sources and methodologies.