General Music is a concentration offered under the music major at University of Northern Colorado. We’ve gathered data and other essential information about the master’s degree program in general music, such as diversity of students, how many students graduated in recent times, and more.
If there’s something special you’re looking for, you can use one of the links below to find it:
Learn about start dates, transferring credits, availability of financial aid, and more by contacting the universities below.
Earn the music business degree that fits into the business world – and partners Southern New Hampshire University with world-renowned Berklee College of Music.
Out-of-state part-time graduates at University of Northern Colorado paid an average of $1,090 per credit hour in 2019-2020. The average for in-state students was $604 per credit hour. The average full-time tuition and fees for graduate students are shown in the table below.
| In State | Out of State | |
|---|---|---|
| Tuition | $10,867 | $19,620 |
| Fees | $2,088 | $2,088 |
Online degrees for the University of Northern Colorado general music master’s degree program are not available at this time. To see if the school offers distance learning options in other areas, visit the University of Northern Colorado Online Learning page.
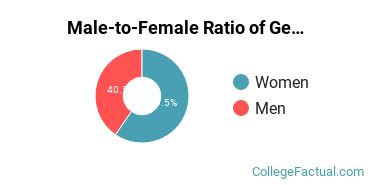
Women made up around 50.0% of the general music students who took home a master’s degree in 2019-2020. This is higher than the nationwide number of 47.9%.
Around 11.1% of general music master’s degree recipients at University of Northern Colorado in 2019-2020 were awarded to racial-ethnic minorities*. This is lower than the nationwide number of 21%.

| Race/Ethnicity | Number of Students |
|---|---|
| Asian | 0 |
| Black or African American | 0 |
| Hispanic or Latino | 2 |
| Native American or Alaska Native | 0 |
| Native Hawaiian or Pacific Islander | 0 |
| White | 20 |
| International Students | 12 |
| Other Races/Ethnicities | 2 |
*The racial-ethnic minorities count is calculated by taking the total number of students and subtracting white students, international students, and students whose race/ethnicity was unknown. This number is then divided by the total number of students at the school to obtain the racial-ethnic minorities percentage.
More about our data sources and methodologies.
