College Factual recognizes the best colleges and universities in its annual rankings. These rankings include categories for best overall colleges, best colleges for each major, best value schools, and much more.
Alaska Pacific University was awarded 6 badges in the 2025 rankings. The highest ranked major at the school is general business administration and management.
Explore the best ranked schools for the programs you are most interested in.
Alaska Pacific was not ranked in College Factual's 2025 Best Overall Colleges report. This could be for a number of reasons, including lack of data.
With an acceptance rate of 99%, Alaska Pacific University is easier to get into than many other schools. But that doesn't mean you can slack off on your application. Make sure to treat this school like any other when submitting requested materials and documents.
The student to faculty ratio at Alaska Pacific is an impressive 8 to 1. That's quite good when you compare it to the national average of 15 to 1. This is a good sign that students at the school will have more opportunities for one-on-one interactions with their professors.
In addition to the student to faculty ratio, some people look at what percentage of faculty members are full-time as a sign of how much time professors will be able to spend with their students. This is because part-time teachers may not be be on campus as much as their full-time counterparts.
The full-time faculty percentage at Alaska Pacific University is 50%. This is comparable to the national average of 47%.
Alaska Pacific University has a freshmen retention rate of 82%. That's a good sign that full-time students like the school and their professors enough to want to stick around for another year. It's also a sign that the admissions team did a good job in choosing applicants who were a good fit for the school.
Students are considered to have graduated on time if they finish their studies within four years. At Alaska Pacific the on-time graduation rate of first-time, full-time students is 50%. That is great when compared to the national average of 33.3%
Find out more about the retention and graduation rates at Alaska Pacific University.
During the 2017-2018 academic year, there were 312 undergraduates at Alaska Pacific with 247 being full-time and 65 being part-time.
| $0-30 K | $30K-48K | $48-75 | $75-110K | $110K + |
|---|---|---|---|---|
| $19,606 | $17,622 | $20,862 | $30,422 | $28,461 |
The net price is calculated by adding tuition, room, board and other costs and subtracting financial aid.Note that the net price is typically less than the published for a school. For more information on the sticker price of Alaska Pacific, see our tuition and fees and room and board pages.
Almost 66% of college students who graduated with the class of 2018 took out student loans, but that percentage varies from school to school. At Alaska Pacific, approximately 49% of students took out student loans averaging $4,603 a year. That adds up to $18,412 over four years for those students.
Get more details about paying for Alaska Pacific University.
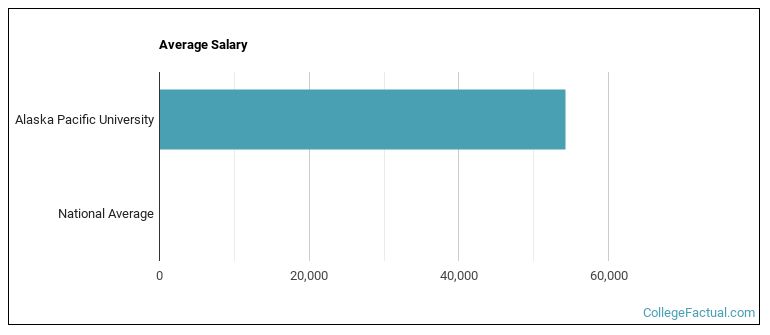
See which majors at Alaska Pacific University make the most money.
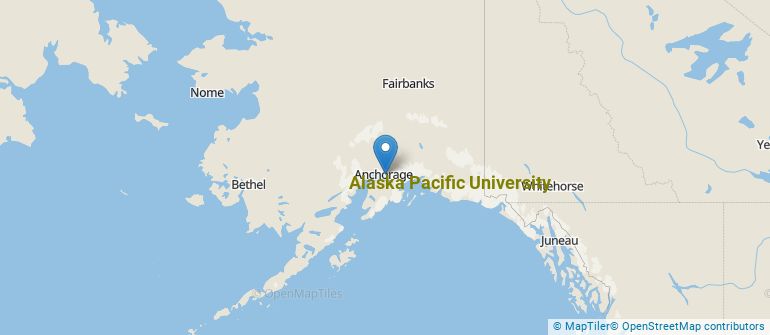
Get more details about the location of Alaska Pacific University.
Contact details for Alaska Pacific are given below.
| Contact Details | |
|---|---|
| Address: | 4101 University Dr, Anchorage, AK 99508 |
| Phone: | 907-561-1266 |
| Website: | www.alaskapacific.edu/ |
| Most Popular Majors | Bachelor’s Degrees | Average Salary of Graduates |
|---|---|---|
| Business Administration & Management | 35 | NA |
| Clinical, Counseling & Applied Psychology | 20 | NA |
| Public Health | 17 | NA |
| Biological & Physical Science | 12 | NA |
| Liberal Arts General Studies | 10 | NA |
| Parks, Recreation & Leisure Studies | 10 | NA |
| Outdoor Education | 8 | NA |
| Natural Resources Conservation | 6 | NA |
| Accounting | 3 | NA |
| Management Information Systems | 3 | NA |
Online learning options are becoming more and more popular at American colleges and universities. Online classes are great for students who have busy schedules or for those who just want to study on their own time.
In 2022-2023, 100 students took at least one online class at Alaska Pacific University. This is a decrease from the 240 students who took online classes the previous year.
| Year | Took at Least One Online Class | Took All Classes Online |
|---|---|---|
| 2022-2023 | 100 | 18 |
| 2021-2022 | 240 | 78 |
| 2020-2021 | 489 | 394 |
| 2018-2019 | 144 | 79 |
Learn more about online learning at Alaska Pacific University.
If you’re considering Alaska Pacific University, here are some more schools you may be interested in knowing more about.
Curious on how these schools stack up against Alaska Pacific? Pit them head to head with College Combat, our free interactive tool that lets you compare college on the features that matter most to you!
Footnotes
*The racial-ethnic minorities count is calculated by taking the total number of students and subtracting white students, international students, and students whose race/ethnicity was unknown. This number is then divided by the total number of students at the school to obtain the racial-ethnic minorities percentage.
References
More about our data sources and methodologies.