How diverse is Allegheny? College Factual’s diversity report shows the data about diversity at Allegheny. We examined racial demographics, gender ratios, student age ranges, and where students come from.
Many schools pride themselves on their diversity, but what does that mean, really? College Factual ran the numbers to find out how diverse the standard college campus really is, taking into account race, gender, the ages of the students, and where they’re from.
Allegheny total enrollment is approximately 1,171 students.
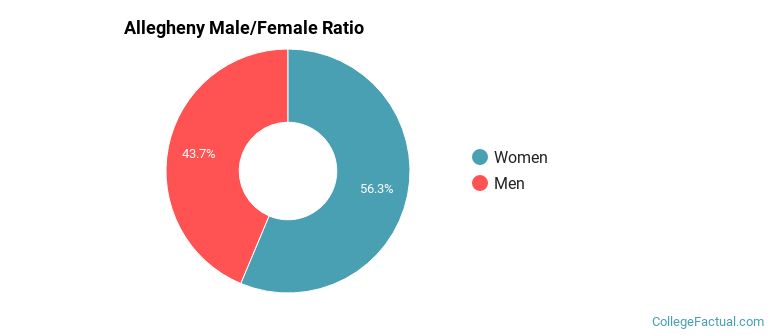
Male/Female Breakdown of Undergraduates
The full-time Allegheny undergraduate population is made up of 51.2% women, and 48.8% men.
For the gender breakdown for all students, go here.
Allegheny Racial/Ethnic Breakdown of Undergraduates
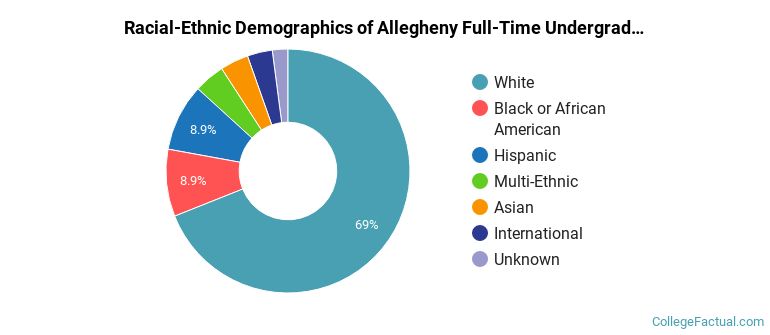
| Race/Ethnicity | Number | Percent |
|---|---|---|
| White | 820 | 70.1% |
| Hispanic | 94 | 8.0% |
| Black or African American | 90 | 7.7% |
| International | 63 | 5.4% |
| Multi-Ethnic | 44 | 3.8% |
| Asian | 34 | 2.9% |
| Unknown | 25 | 2.1% |
See racial/ethnic breakdown for all students.
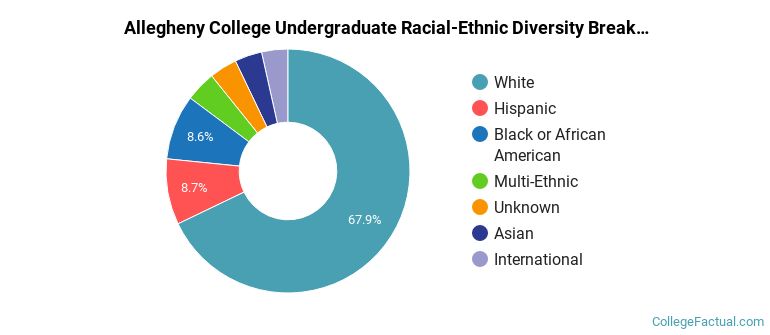
| Race/Ethnicity | Number | Percent |
|---|---|---|
| White | 820 | 70.1% |
| Hispanic | 94 | 8.0% |
| Black or African American | 90 | 7.7% |
| International | 63 | 5.4% |
| Multi-Ethnic | 44 | 3.8% |
| Asian | 34 | 2.9% |
| Unknown | 25 | 2.1% |
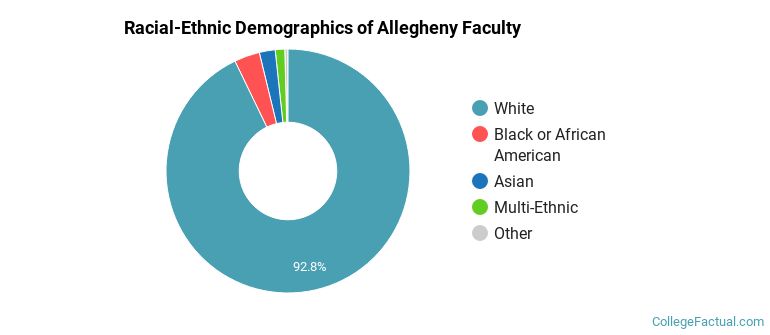
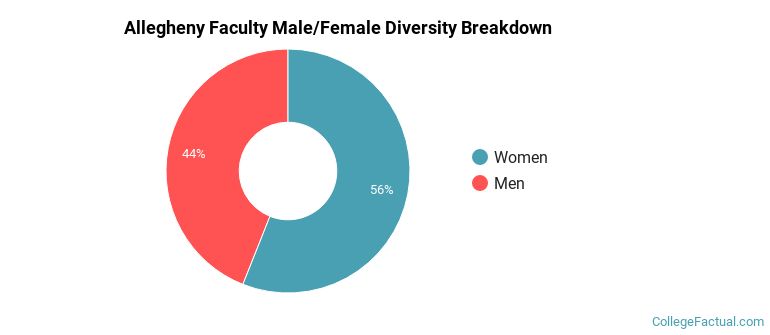
Allegheny College faculty racial/ethnic demographics (share of instructional staff):
| Ethnicity | Percent of Faculty |
|---|---|
| White | 75.9% |
| International | 6.8% |
| Hispanic | 4.5% |
| Asian | 3.8% |
| Black or African American | 3.8% |
| Unknown | 3.8% |
| Native Hawaiian or Pacific Islander | 0.8% |
| Multi-Ethnic | 0.8% |
This school is more popular with women than with men.
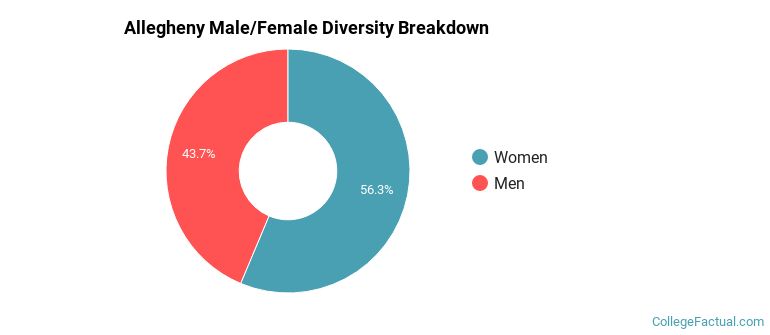
There are approximately 599 female students and 572 male students at Allegheny.
Allegheny College faculty gender breakdown (share of instructional staff):
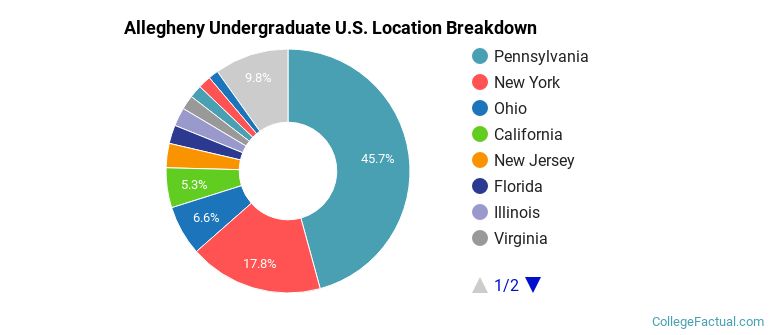
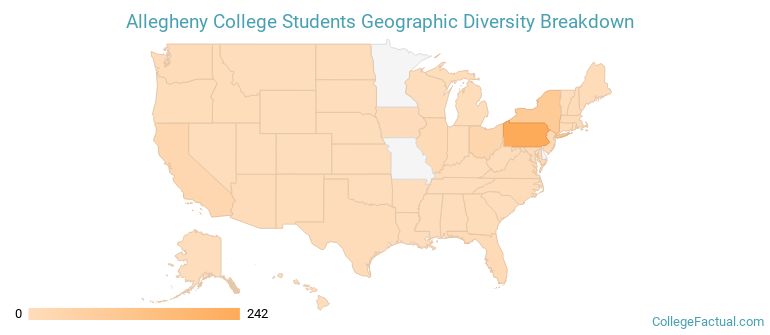
The undergraduate student body is split among 32 states (may include Washington D.C.). Click on the map for more detail.
| State | Amount | Percent |
|---|---|---|
| Pennsylvania | 172 | 57.0% |
| Ohio | 34 | 11.3% |
| New York | 22 | 7.3% |
| Maryland | 9 | 3.0% |
| Texas | 8 | 2.6% |
Allegheny welcomes approximately 5.4% international (nonresident) students, enhancing the multicultural environment of the campus.
A traditional college student is defined as being between the ages of 18-21. At Allegheny, 88.4% of undergraduate students fall into that category, compared to the national average of 60%.
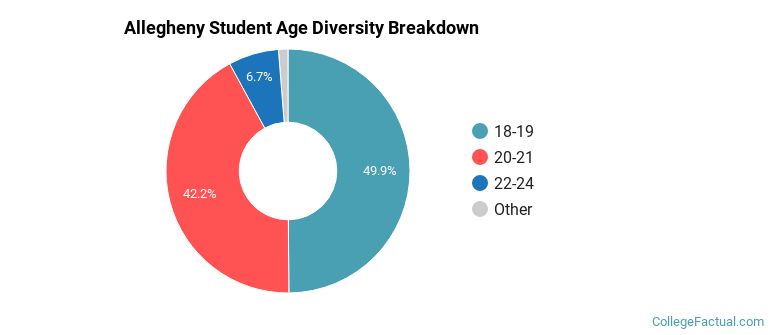
Student Age Group Amount Percent 20-21 545 46.6% 18-19 489 41.8% 22-24 99 8.5% 25-29 17 1.5% Under 18 9 0.8% 35 and over 6 0.5% 30-34 5 0.4%
Footnotes
*The racial-ethnic minorities count is calculated by taking the total number of students and subtracting white students, international students, and students whose race/ethnicity was unknown. This number is then divided by the total number of students at the school to obtain the racial-ethnic minorities percentage.
References