We’ve pulled together the essential facts you should know about the program at AACC. Degrees are awarded at the Associate’s level. Jump to any of the following sections:
Here is each degree level available for non-professional legal studies at AACC, along with how many graduates complete each level annually.Degree Level Annual Graduates Associate’s 5
During the most recent reporting year, Anne Arundel Community College handed out 5 associate’s degrees in non-professional legal studies.
AACC is not currently ranked for non-professional legal studies at the associate’s level.
The full-time undergraduate tuition and fees are shown below.In State Out of State Tuition $7,590 $10,200 Fees $1,322 $1,322
Learn more about AACC tuition and fees.
For the most recent academic year available, 20% of non-professional legal studies associate’s degrees went to men and 80% went to women.
 The majority of non-professional legal studies associate’s degree graduates at AACC are Black or African American. Approximately 60% of graduates fell into this category.
The following table and chart show the ethnic background for students who recently graduated from Anne Arundel Community College with a associate’s in non-professional legal studies.
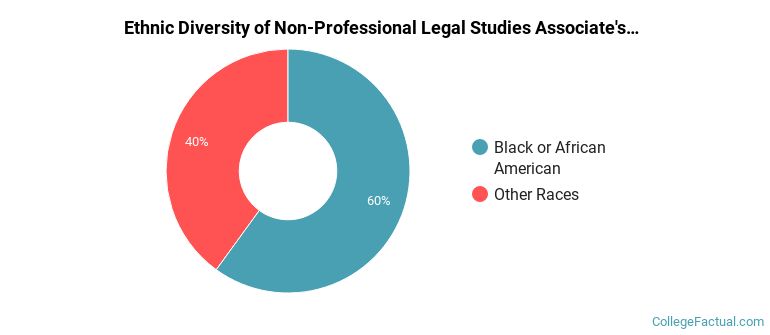
| Ethnic Background | Number of Students |
|---|---|
| Asian | 0 |
| Black or African American | 3 |
| Hispanic or Latino | 0 |
| White | 0 |
| Non-Resident Aliens | 0 |
| Other Races | 2 |
AACC granted 5 associate’s degrees in pre-law studies in the most recent reporting year — 80% to women and 20% to men. Most of these graduates identified as Black or African American (60%).
More about our data sources and methodologies.