 by our College Data Analytics Team
Make an informed decision about your education by understanding Biola retention and graduation rates. First year retention rates let you know how many first-time, full-time students students come back for their second year. Graduation rates tell you how many students complete their degree and how long it takes.
Freshmen retention rate refers to the percentage of first-time / full-time students who return for their second year.
With 84% students making it past their freshmen year, Biola has freshmen retention rates above the national average.
Nationwide, the average first to second year retention rate is 70.57%.
When looking at just colleges and universities in California, the average is 73.07%.
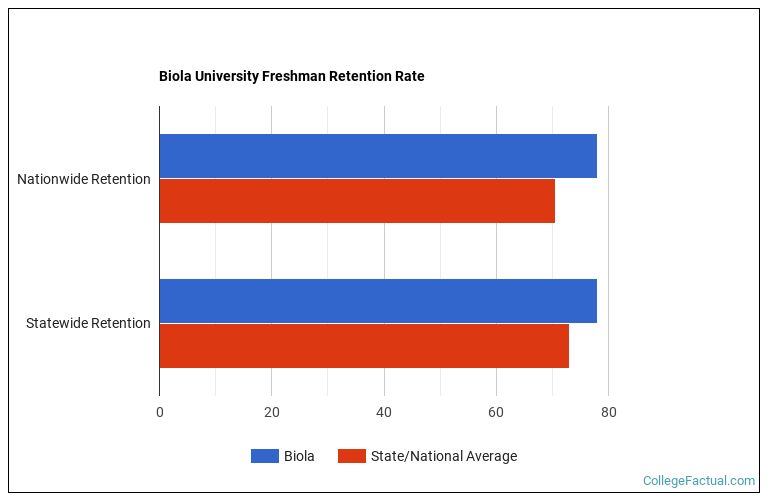
| Retention Rate | |
|---|---|
| Biola | 84% |
| Nationwide | 70.57% |
| California | 73.07% |
How many of the estimated 839 students in the class of 2023 actually finished their degree in a timely fashion?
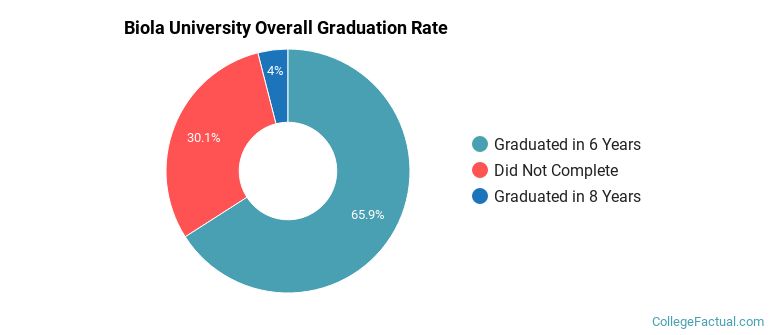
Four years after beginning their degree, 59% of those students had graduated. By 2025, six years after starting their degree, 70% of the students had graduated and after eight years 71% of this class completed their degree.
Any student who completes their bachelor's degree within six years is considered to have graduated on time, according to the National Center for Education Statistics. This makes the offical Biola graduation rate 70%.
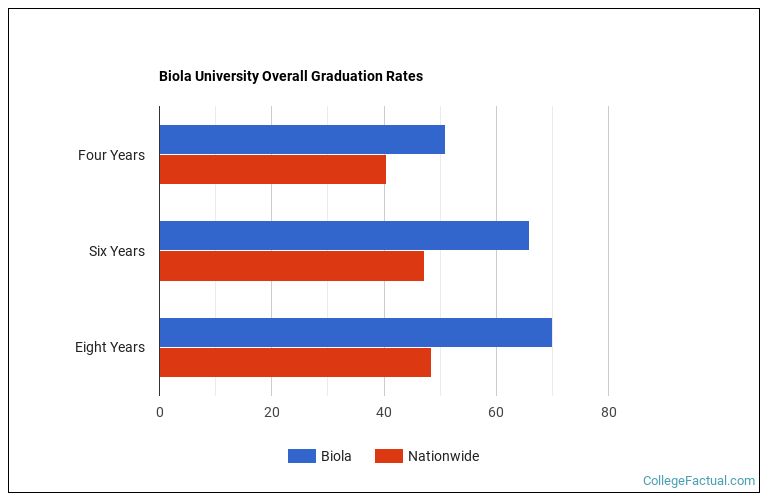
| Completion Within | Undergraduates | Percentage |
|---|---|---|
| Four Years | 708 | 59% |
| Six Years | 839 | 70% |
| Eight Years | 13 | 1% |
| Did Not Complete | 349 | 29% |
The non-completers rate is anyone who is not still enrolled at the institution after eight years. Both transfer students and drop-outs could be included in this group.
Approximately 349 students or 29% of the cohort did not complete their degree within eight years.
What happened to the 349 students who did not complete their degree?
1 are still enrolled.
270 transferred to another institution.
Biola lost contact with the remaining 78 who we assumed dropped out.
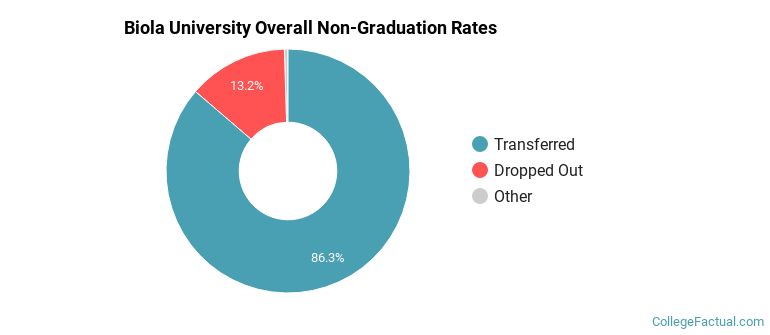
| Non-Completions | Undergraduates | Percentage |
|---|---|---|
| Still Enrolled | 1 | 0.3% |
| Transferred | 270 | 77.4% |
| Dropped Out | 78 | 22.3% |
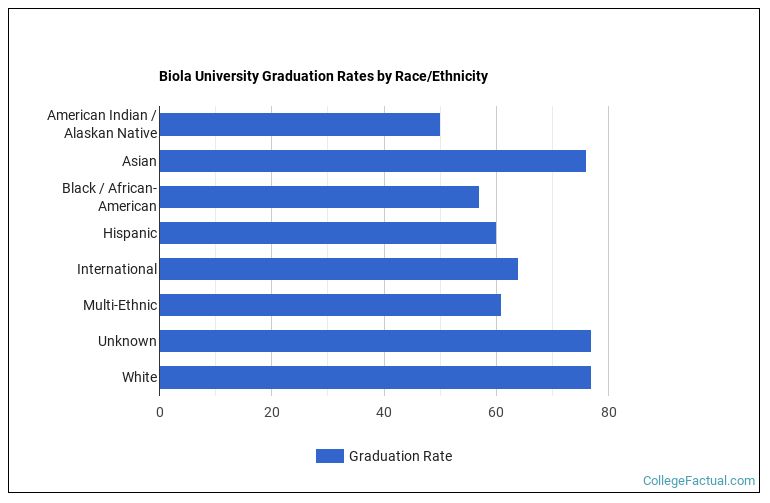
| Race/Ethnicity | Graduation Rate |
|---|---|
| Asian | 72% |
| Black / African-American | 47% |
| Hawaiian | 67% |
| Hispanic | 58% |
| International | 72% |
| Multi-Ethnic | 72% |
| Unknown | 77% |
| White | 72% |
Traditional first-time, full-time students under 25 tend to graduate in four years far more often than other students. Some schools serve mostly traditional students while others serve more 'non-traditional' students — part-timers or those returning after time away — who commonly take longer to finish.
Traditional Students:
First-time, full-time students under the age of 25.
Non-Traditional Students:
Any student that is not first-time, full-time, and under the age of 25.
The majority of students at Biola are considered 'traditional students' who are first-time attending full-time.
Looking at the individual cohorts below may tell you more than the overall graduation rate alone.
First-time / full-time students at Biola University represent 72.28% of the students in the class of 2023.
After six years, the Biola graduation rate was 72%, and by the eight year mark, 73% of the cohort had completed their degree.
Nationwide, the average graduation rate for this group is 37.92% after four years, 46.43% after six years, and 47.82% after eight years.
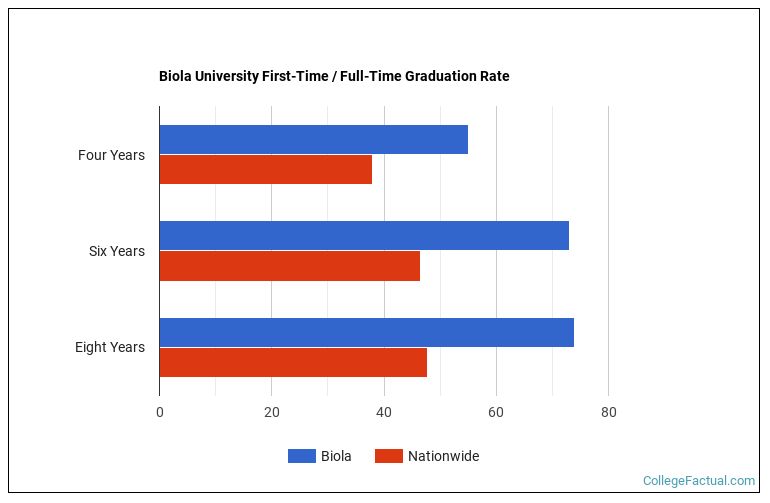
| Completions | Biola | Nationwide |
|---|---|---|
| Four Years | 60% | 37.92% |
| Six Years | 72% | 46.43% |
| Eight Years | 73% | 47.82% |
230 first-time / full-time students or 27% did not complete their degree within eight years.
Of those who did not finish:
1 are still enrolled.
184 transferred to another institution.
Biola lost contact with the remaining 45 who we assumed dropped out.
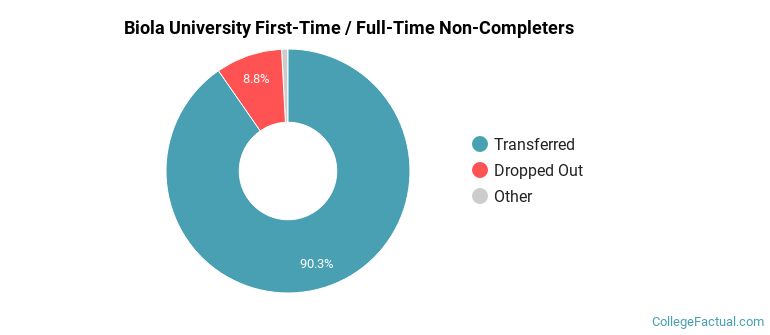
| Non-Completions | Undergraduates | Percentage |
|---|---|---|
| Still Enrolled | 1 | 0.43% |
| Transferred | 184 | 80.00% |
| Dropped Out | 45 | 19.57% |
First-time / part-time students at Biola University represent 0.75% of the students in the class of 2023.
After six years, the Biola graduation rate was 33%, and by the eight year mark, 33% of the cohort had completed their degree.
Nationwide, the average graduation rate for this group is 14.37% after four years, 21.59% after six years, and 23.72% after eight years.
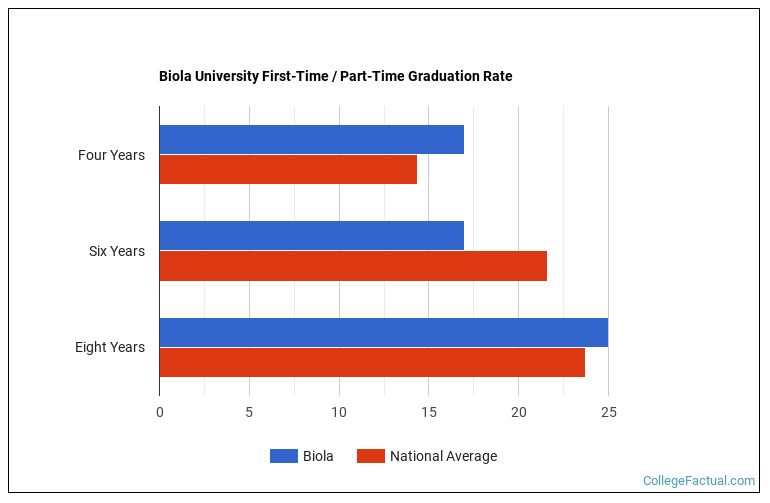
| Completions | Biola | Nationwide |
|---|---|---|
| Four Years | 22% | 14.37% |
| Six Years | 33% | 21.59% |
| Eight Years | 33% | 23.72% |
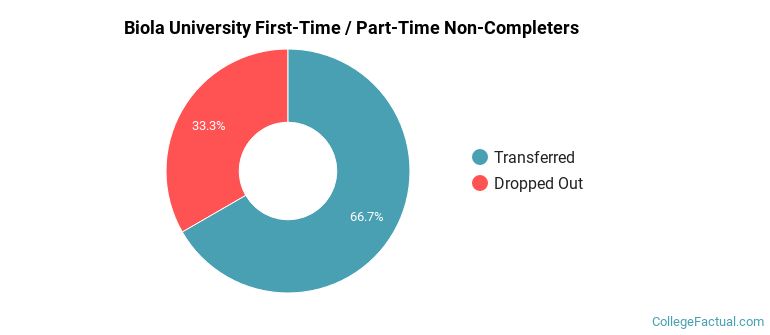
6 first-time / part-time students or 67% did not complete their degree within eight years.
Of those who did not finish:
0 are still enrolled.
4 transferred to another institution.
Biola lost contact with the remaining 2 who we assumed dropped out.
| Non-Completions | Undergraduates | Percentage |
|---|---|---|
| Still Enrolled | 0 | 0.00% |
| Transferred | 4 | 66.67% |
| Dropped Out | 2 | 33.33% |
Returning / full-time students at Biola University represent 25.06% of the students in the class of 2023.
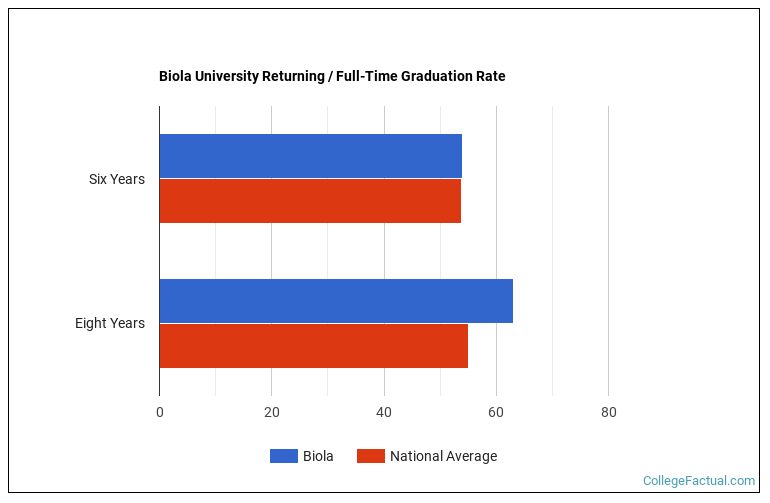
After six years, the Biola graduation rate was 66%, and by the eight year mark, 67% of the cohort had completed their degree.
Nationwide, the average graduation rate for this group is 53.83% after six years, and 55.07% after eight years.
| Completions | Biola | Nationwide |
|---|---|---|
| Four Years | 0% | 49.57% |
| Six Years | 66% | 53.83% |
| Eight Years | 67% | 55.07% |
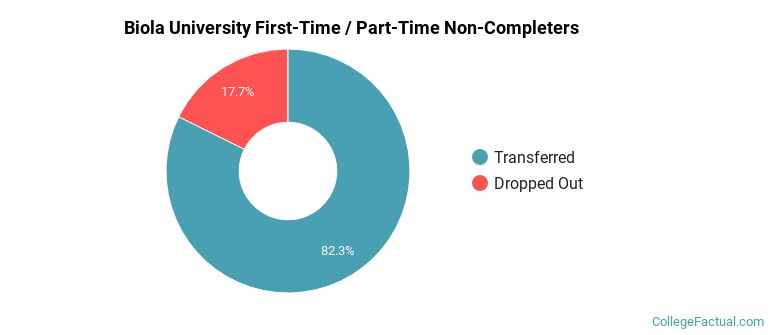
101 non first-time / part-time students or 33% did not complete their degree within eight years.
Of those who did not finish:
0 are still enrolled.
80 transferred to another institution.
Biola lost contact with the remaining 21 who we assumed dropped out.
| Non-Completions | Undergraduates | Percentage |
|---|---|---|
| Still Enrolled | 0 | 0.00% |
| Transferred | 80 | 79.21% |
| Dropped Out | 21 | 20.79% |
Returning / part-time students at Biola University represent 1.91% of the students in the class of 2023.
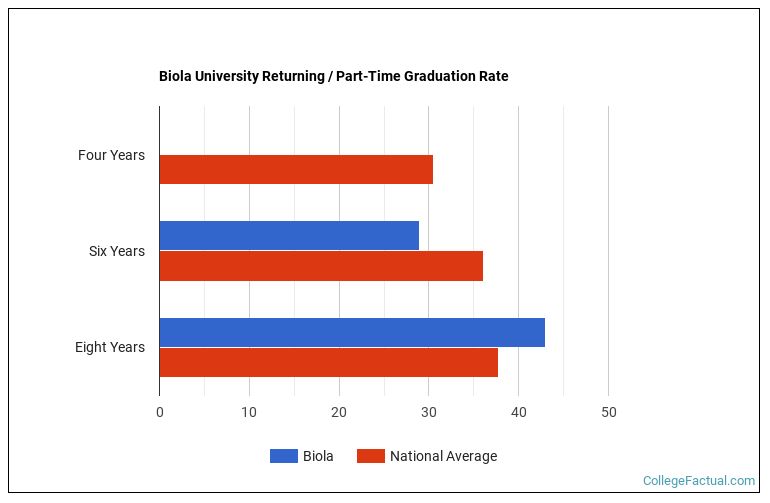
After six years, the Biola graduation rate was 48%, and by the eight year mark, 48% of the cohort had completed their degree.
Nationwide, the average graduation rate for this group is 30.46% after four years, 36.03% after six years, and 37.80% after eight years.
| Completions | Biola | Nationwide |
|---|---|---|
| Four Years | 35% | 30.46% |
| Six Years | 48% | 36.03% |
| Eight Years | 48% | 37.80% |
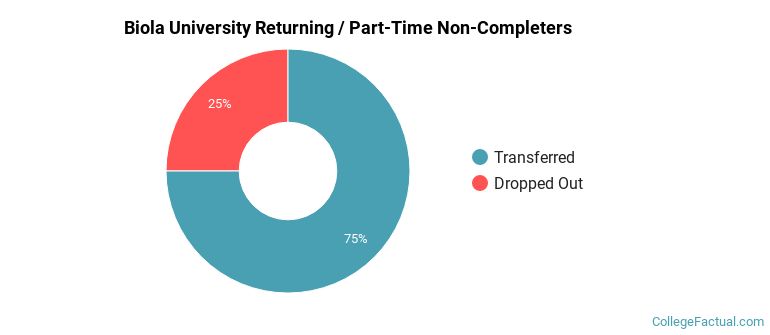
12 non first-time / part-time students or 52% did not complete their degree within eight years.
Of those who did not finish:
0 are still enrolled.
2 transferred to another institution.
Biola lost contact with the remaining 10 who we assumed dropped out.
| Non-Completions | Undergraduates | Percentage |
|---|---|---|
| Still Enrolled | 0 | 0.00% |
| Transferred | 2 | 16.67% |
| Dropped Out | 10 | 83.33% |
