Below are the key facts about this program at BU. You can study it at the Bachelor’s, Undergraduate Certificate levels, with graduate study also available. Its best result is a rank of #1 out of 6 schools (Bachelor’s level) by College Factual. Jump to any of the following sections:
College Factual rates BU as a strong choice for teacher education subject specific, placing at #24 out of 554 schools nationally.
The following degree levels are available for teacher education subject specific at BU, along with how many graduates complete each level annually.
| Degree Level | Annual Graduates |
|---|---|
| Bachelor’s | 12 |
| Undergraduate Certificate | 6 |
| Master’s | 119 |
| Doctoral | 28 |
| Professional Certificate | 7 |
For the most recent IPEDS reporting year, Boston University conferred 12 bachelor’s degrees in teacher education subject specific.
BU is among the very best schools in the country for teacher education subject specific at the bachelor’s level. In particular it placed #1 out of 6 schools by College Factual.
Teacher Education Subject Specific graduates with a bachelor’s degree from BU earn a median of $63,765 a year. This is below $86,455, the median for all majors at BU.
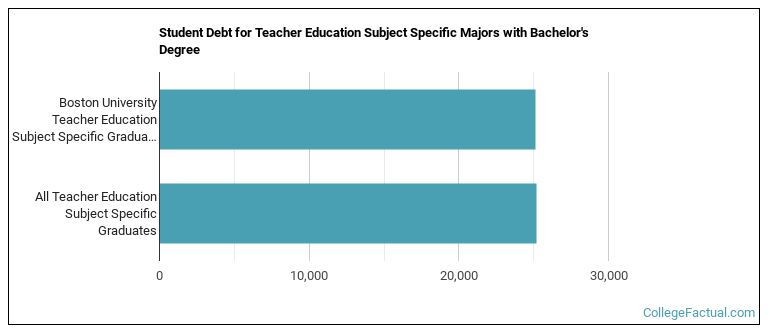
Earning a bachelor’s degree at BU, teacher education subject specific students accumulate a median of $25,125 in student loans. This is lower than $25,188, the typical median for all majors at BU.
The full-time undergraduate tuition and fees are shown below.
| In State | Out of State | |
|---|---|---|
| Tuition | $58,560 | $66,670 |
| Fees | $1,432 | $1,432 |
Learn more about BU tuition and fees.
For the most recent academic year available, 33% of teacher education subject specific bachelor’s degrees went to men and 67% went to women.
 The largest share of teacher education subject specific bachelor’s degree graduates at BU are White. About 50% of graduates fell into this category.
The following table and chart show the ethnic background for students who recently graduated from Boston University with a bachelor’s in teacher education subject specific.

| Ethnic Background | Number of Students |
|---|---|
| Asian | 3 |
| Black or African American | 0 |
| Hispanic or Latino | 3 |
| White | 6 |
| Non-Resident Aliens | 0 |
| Other Races | 0 |
BU granted 4 bachelor’s degrees in music teacher education recently — 50% to women and 50% to men. The largest share of these graduates were White (75%).
BU granted 3 bachelor’s completions in english/language arts teacher education in the latest year of data — 33% to women and 67% to men. The most common background among these graduates was Asian (67%).
BU conferred 2 bachelor’s degrees in science teacher education/general science teacher education recently — 100% to women and 0% to men. Most of these graduates identified as Hispanic or Latino (50%).
BU awarded 1 bachelor’s completion in art teacher education recently — 100% to women and 0% to men. The largest share of these graduates were Hispanic or Latino (100%).
BU awarded 1 bachelor’s completion in mathematics teacher education in the most recent reporting year — 100% to women and 0% to men. Most of these graduates identified as Hispanic or Latino (100%).
BU conferred 1 bachelor’s degree in social studies teacher education in the most recent reporting year — 100% to women and 0% to men. The most common background among these graduates was White (100%).
For the most recent IPEDS reporting year, Boston University awarded 6 undergraduate certificate degrees in teacher education subject specific.
BU is not yet ranked for teacher education subject specific at the undergraduate certificate level.
In the most recent graduating class, 50% of teacher education subject specific undergraduate certificate degrees went to men and 50% went to women.
 The majority of teacher education subject specific undergraduate certificate degree graduates at BU were White. Roughly 83% of graduates fell into this category.
The following table and chart show the ethnic background for students who recently graduated from Boston University with a undergraduate certificate in teacher education subject specific.

| Ethnic Background | Number of Students |
|---|---|
| Asian | 0 |
| Black or African American | 0 |
| Hispanic or Latino | 1 |
| White | 5 |
| Non-Resident Aliens | 0 |
| Other Races | 0 |
BU conferred 6 undergraduate certificate degrees in teacher education and professional development, specific subject areas, other in the latest year of data — 50% to women and 50% to men. The largest share of these graduates were White (83%).
You can also pursue this field at the graduate level at BU. The following graduate award levels are reported.
