We've pulled together some essential information you should know about the program, including how many students graduate each year, the ethnic diversity of these students, average starting salaries, and more. Also, learn how Sac State ranks among other schools offering degrees in political science.
Jump to any of the following sections:
Learn about start dates, transferring credits, availability of financial aid, and more by contacting the universities below.
Gain a solid understanding of American political history, the current political landscape, and the major political parties with this online bachelor's from Southern New Hampshire University.
The bachelor's program at Sac State was ranked #111 on College Factual's Best Schools for political science list. It is also ranked #16 in California.
| Ranking Type | Rank |
|---|---|
| Best Political Science & Government Schools | 111 |
| Best Political Science & Government Bachelor’s Degree Schools | 112 |
During the 2021-2022 academic year, California State University - Sacramento handed out 143 bachelor's degrees in political science & government. This is a decrease of 8% over the previous year when 156 degrees were handed out.
In 2022, 11 students received their master’s degree in political science from Sac State. This makes it the #40 most popular school for political science master’s degree candidates in the country.
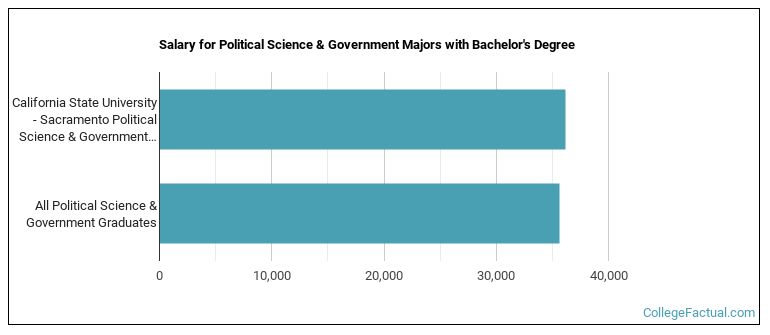
Political Science majors who earn their bachelor's degree from Sac State go on to jobs where they make a median salary of $36,189 a year. This is higher than $35,631, which is the national median for all political science bachelor's degree recipients.
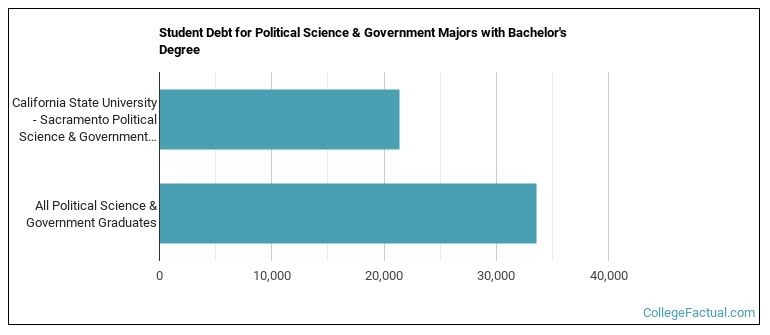
While getting their bachelor's degree at Sac State, political science students borrow a median amount of $21,361 in student loans. This is not too bad considering that the median debt load of all political science bachelor's degree recipients across the country is $33,583.
The typical student loan payment of a bachelor's degree student from the political science program at Sac State is $201 per month.
Information about average full-time undergraduate tuition and fees is shown in the table below.
| In State | Out of State | |
|---|---|---|
| Tuition | $5,742 | $17,622 |
| Fees | $1,860 | $1,860 |
| Books and Supplies | $1,112 | $1,112 |
| On Campus Room and Board | $16,278 | $16,278 |
| On Campus Other Expenses | $4,426 | $4,426 |
Learn more about Sac State tuition and fees.
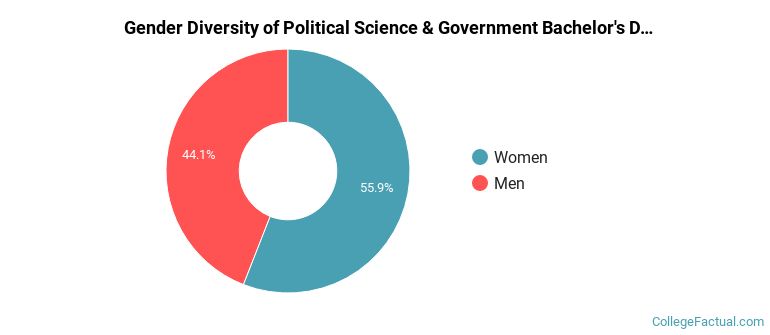
Of the 143 students who graduated with a Bachelor’s in political science from Sac State in 2022, 44% were men and 56% were women.
The following table and chart show the ethnic background for students who recently graduated from California State University - Sacramento with a bachelor's in political science.
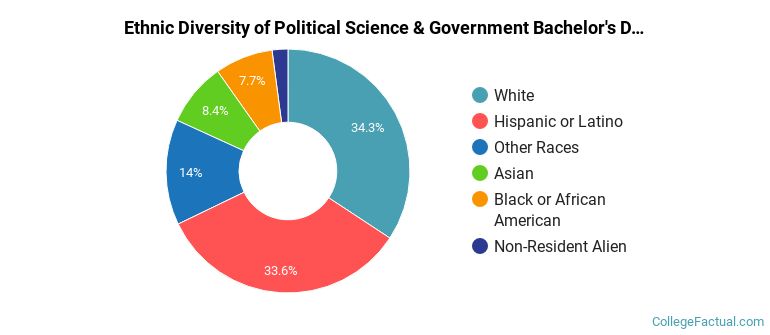
| Ethnic Background | Number of Students |
|---|---|
| Asian | 12 |
| Black or African American | 11 |
| Hispanic or Latino | 48 |
| White | 49 |
| Non-Resident Aliens | 3 |
| Other Races | 20 |
Online degrees for the Sac State political science bachelor’s degree program are not available at this time. To see if the school offers distance learning options in other areas, visit the Sac State Online Learning page.
For the most recent academic year available, 60% of political science master's degrees went to men and 40% went to women.

The following table and chart show the ethnic background for students who recently graduated from California State University - Sacramento with a master's in political science.
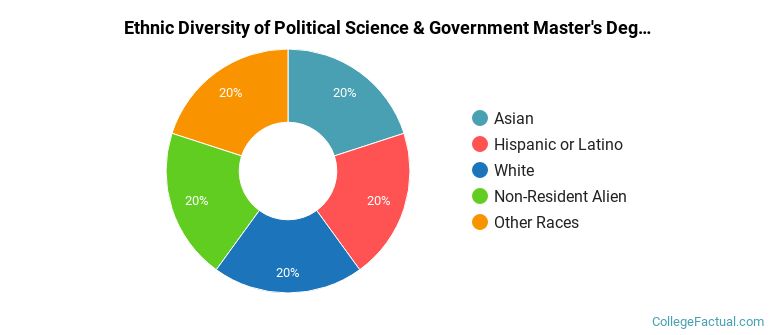
| Ethnic Background | Number of Students |
|---|---|
| Asian | 1 |
| Black or African American | 0 |
| Hispanic or Latino | 1 |
| White | 1 |
| Non-Resident Aliens | 1 |
| Other Races | 1 |
Take a look at the following statistics related to the make-up of the political science majors at California State University - Sacramento.
| Related Major | Annual Graduates |
|---|---|
| Sociology | 285 |
| Economics | 167 |
| Anthropology | 62 |
| Geography & Cartography | 36 |
| General Social Sciences | 27 |
More about our data sources and methodologies.
