
College Factual analyzes over 2,000 colleges and universities in its annual rankings and ranks them in a variety of ways, including most diverse, best overall quality, best for non-traditional students, and much more.
Catawba Valley Community College was awarded 4 badges in the 2025 rankings. The highest ranked major at the school is general studies.
Explore the best ranked schools for the programs you are most interested in.
College Factual ranked CVCC as #867 out of 2,152 colleges and universities in the country on its 2025 Best Colleges list.
CVCC is also ranked #25 out of 93 schools in North Carolina.
See all of the rankings for Catawba Valley Community College.
If you are worried about getting into Catawba Valley Community College, don't be. The school has a liberal open admissions policy, which means you only need to meet basic requirements in order to be admitted. Still, be sure to submit a complete application and provide any other requested materials.
The student to faculty ratio at CVCC is an impressive 9 to 1. That's quite good when you compare it to the national average of 15 to 1. This is a good sign that students at the school will have more opportunities for one-on-one interactions with their professors.
Another measure that is often used to estimate how much access students will have to their professors is how many faculty members are full-time. The idea here is that part-time faculty tend to spend less time on campus, so they may not be as available to students as full-timers.
The full-time faculty percentage at Catawba Valley Community College is 29%. This is lower than the national average of 47%.
The freshmen retention rate tells us what percentage of first-year, full-time students choose to continue on to their sophomore year at a particular school. The rate at Catawba Valley Community College is 63%, which is about average when compared to the national rate of 68%.
During the 2017-2018 academic year, there were 4,328 undergraduates at CVCC with 1,318 being full-time and 3,010 being part-time.
The net price is calculated by adding tuition, room, board and other costs and subtracting financial aid.Note that the net price is typically less than the published for a school. For more information on the sticker price of CVCC, see our tuition and fees and room and board pages.
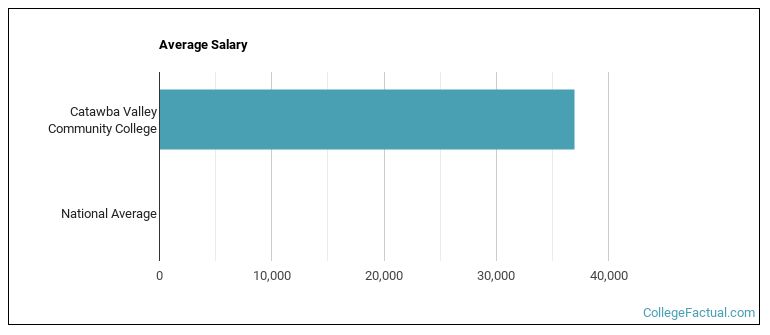
See which majors at Catawba Valley Community College make the most money.
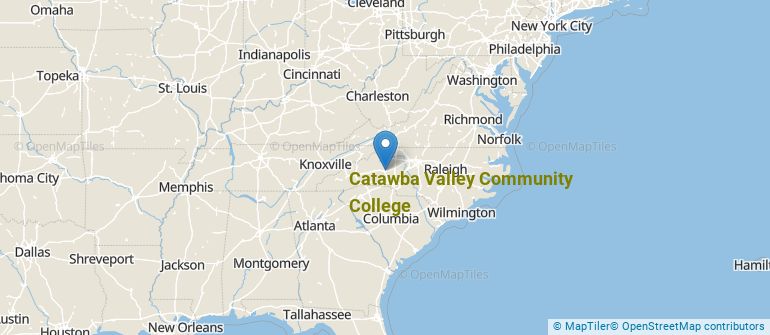
Get more details about the location of Catawba Valley Community College.
Contact details for CVCC are given below.
| Contact Details | |
|---|---|
| Address: | 2550 Hwy 70 Se, Hickory, NC 28602-0699 |
| Phone: | 828-327-7000 |
| Website: | www.cvcc.edu/ |
| Most Popular Majors | Bachelor’s Degrees | Average Salary of Graduates |
|---|---|---|
| Liberal Arts General Studies | 613 | NA |
| Business Administration & Management | 231 | NA |
| Health & Medical Administrative Services | 103 | NA |
| Computer Information Systems | 95 | NA |
| Nursing | 79 | NA |
| Electromechanical Engineering Technology | 69 | NA |
| Precision Metal Working | 67 | NA |
| Vehicle Maintenance & Repair | 55 | NA |
| Allied Health Professions | 54 | NA |
| Accounting | 50 | NA |
Online learning is becoming popular at even the oldest colleges and universities in the United States. Not only are online classes great for returning adults with busy schedules, they are also frequented by a growing number of traditional students.
In 2022-2023, 3,740 students took at least one online class at Catawba Valley Community College. This is an increase from the 3,677 students who took online classes the previous year.
| Year | Took at Least One Online Class | Took All Classes Online |
|---|---|---|
| 2022-2023 | 3,740 | 2,584 |
| 2021-2022 | 3,677 | 2,413 |
| 2020-2021 | 4,102 | 3,702 |
| 2018-2019 | 2,474 | 678 |
Learn more about online learning at Catawba Valley Community College.
Footnotes
*The racial-ethnic minorities count is calculated by taking the total number of students and subtracting white students, international students, and students whose race/ethnicity was unknown. This number is then divided by the total number of students at the school to obtain the racial-ethnic minorities percentage.
References
More about our data sources and methodologies.