Explore the best ranked schools for the programs you are most interested in.
Harry S Truman College landed the #1,958 spot in College Factual's 2025 ranking of best overall colleges in the United States. The higher ed experts analyzed 2,152 colleges and universities across the nation to determine this ranking.
Harry S Truman College is also ranked #81 out of 85 schools in Illinois.
See all of the rankings for City Colleges of Chicago - Harry S Truman College.
Since City Colleges of Chicago - Harry S Truman College has an open admissions policy, being accepted to the school isn't that hard. However, a full basic things - such as a high school diploma or equivalent - may be required. Also, go over your application to make sure it is complete before you submit it.
The student to faculty ratio at City Colleges of Chicago - Harry S Truman College is 23 to 1, which is high when compared to the national average of 15 to 1. This may indicate that some of your classes will be larger in size than they would be at other schools. However, upper level classes will probably be smaller.
In addition to the student to faculty ratio, some people look at what percentage of faculty members are full-time as a sign of how much time professors will be able to spend with their students. This is because part-time teachers may not be be on campus as much as their full-time counterparts.
The full-time faculty percentage at City Colleges of Chicago - Harry S Truman College is 30%. This is lower than the national average of 47%.
The freshmen retention rate tells us what percentage of first-year, full-time students choose to continue on to their sophomore year at a particular school. The rate at City Colleges of Chicago - Harry S Truman College is 63%, which is about average when compared to the national rate of 68%.
During the 2017-2018 academic year, there were 5,186 undergraduates at Harry S Truman College with 1,201 being full-time and 3,985 being part-time.
| $0-30 K | $30K-48K | $48-75 | $75-110K | $110K + |
|---|---|---|---|---|
| $3,510 | $3,690 | $5,219 | $8,268 | $3,162 |
The net price is calculated by adding tuition, room, board and other costs and subtracting financial aid.Note that the net price is typically less than the published for a school. For more information on the sticker price of Harry S Truman College, see our tuition and fees and room and board pages.
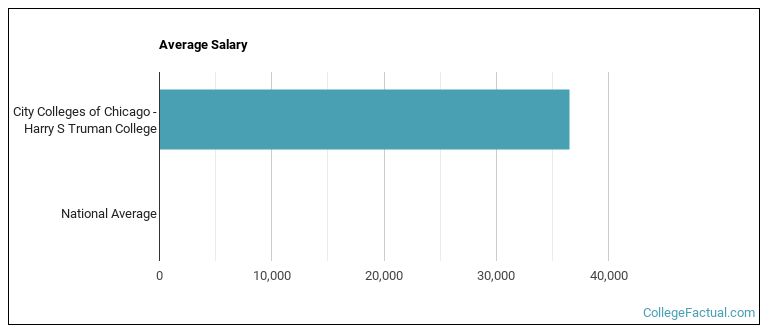
See which majors at City Colleges of Chicago - Harry S Truman College make the most money.
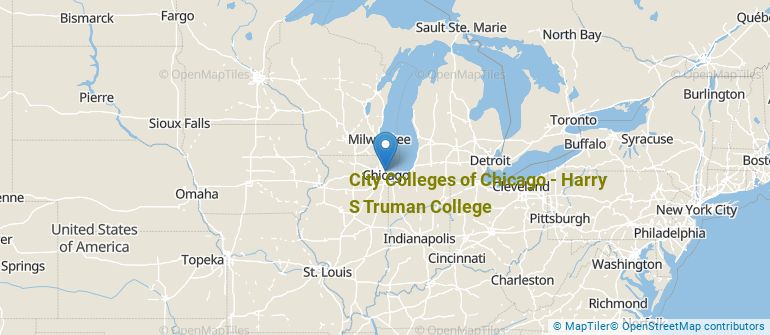
Get more details about the location of City Colleges of Chicago - Harry S Truman College.
Contact details for Harry S Truman College are given below.
| Contact Details | |
|---|---|
| Address: | 1145 W Wilson Ave., Chicago, IL 60640-6063 |
| Phone: | 773-907-4000 |
| Website: | www.ccc.edu/colleges/truman/Pages/default.aspx |
| Most Popular Majors | Bachelor’s Degrees | Average Salary of Graduates |
|---|---|---|
| Liberal Arts General Studies | 334 | NA |
| Human Development & Family Studies | 111 | NA |
| Biological & Physical Science | 88 | NA |
| General Education | 60 | NA |
| Vehicle Maintenance & Repair | 52 | NA |
| Cosmetology | 33 | NA |
| Information Science | 10 | NA |
| General Engineering | 8 | NA |
| Accounting | 7 | NA |
| Computer Systems Networking | 3 | NA |
Online learning options are becoming more and more popular at American colleges and universities. Online classes are great for students who have busy schedules or for those who just want to study on their own time.
In 2022-2023, 2,046 students took at least one online class at City Colleges of Chicago - Harry S Truman College. This is a decrease from the 2,381 students who took online classes the previous year.
| Year | Took at Least One Online Class | Took All Classes Online |
|---|---|---|
| 2022-2023 | 2,046 | 1,381 |
| 2021-2022 | 2,381 | 1,898 |
| 2020-2021 | 5,015 | 4,932 |
| 2018-2019 | 518 | 193 |
Learn more about online learning at City Colleges of Chicago - Harry S Truman College.
Footnotes
*The racial-ethnic minorities count is calculated by taking the total number of students and subtracting white students, international students, and students whose race/ethnicity was unknown. This number is then divided by the total number of students at the school to obtain the racial-ethnic minorities percentage.
References
More about our data sources and methodologies.