Here, you'll find out more about the major, including such details as the number of graduates, what degree levels are offered, ethnicity of students, average salaries, and more. Also, learn how Clemson ranks among other schools offering degrees in agricultural production.
Jump to any of the following sections:
The bachelor's program at Clemson was ranked #12 on College Factual's Best Schools for agricultural production list. It is also ranked #1 in South Carolina.
| Ranking Type | Rank |
|---|---|
| Best Agricultural Production Bachelor’s Degree Schools | 9 |
| Best Agricultural Production Schools | 12 |
During the 2021-2022 academic year, Clemson University handed out 33 bachelor's degrees in agricultural production. Last year, the same number of degrees were handed out.
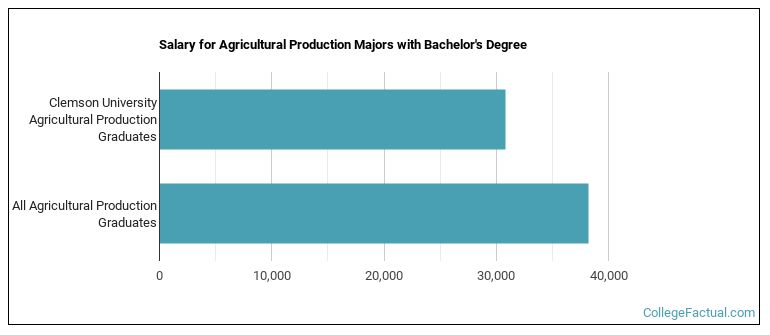
Agricultural Production majors who earn their bachelor's degree from Clemson go on to jobs where they make a median salary of $30,825 a year. This is less than $38,189, which is the national median of all agricultural production majors in the nation who earn bachelor's degrees.
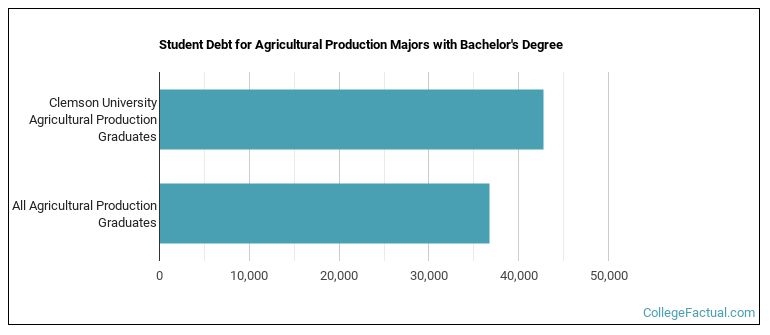
While getting their bachelor's degree at Clemson, agricultural production students borrow a median amount of $42,777 in student loans. This is higher than the the typical median of $36,740 for all agricultural production majors across the country.
Out-of-state part-time undergraduates at Clemson paid an average of $1,695 per credit hour in 2022-2023. The average for in-state students was $654 per credit hour. The average full-time tuition and fees for undergraduates are shown in the table below.
| In State | Out of State | |
|---|---|---|
| Tuition | $14,038 | $37,982 |
| Fees | $1,516 | $1,516 |
| Books and Supplies | $1,436 | $1,436 |
| On Campus Room and Board | $12,872 | $12,872 |
| On Campus Other Expenses | $5,476 | $5,476 |
Learn more about Clemson tuition and fees.
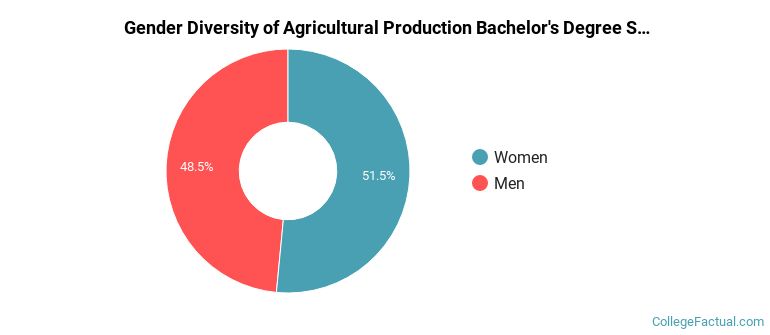
During the 2021-2022 academic year, 33 students graduated with a bachelor's degree in agricultural production from Clemson. About 48% were men and 52% were women.
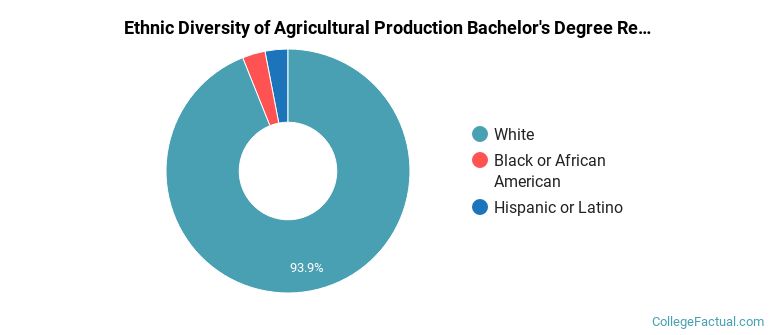
The majority of the students with this major are white. About 94% of 2022 graduates were in this category.
The following table and chart show the ethnic background for students who recently graduated from Clemson University with a bachelor's in agricultural production.
| Ethnic Background | Number of Students |
|---|---|
| Asian | 0 |
| Black or African American | 1 |
| Hispanic or Latino | 1 |
| White | 31 |
| Non-Resident Aliens | 0 |
| Other Races | 0 |
Clemson does not offer an online option for its agricultural production bachelor’s degree program at this time. To see if the school offers distance learning options in other areas, visit the Clemson Online Learning page.
Take a look at the following statistics related to the make-up of the agricultural production majors at Clemson University.
| Related Major | Annual Graduates |
|---|---|
| Animal Science | 107 |
| Food Science Technology | 77 |
| Agricultural Economics & Business | 63 |
| Plant Sciences | 42 |
| Soil Sciences | 10 |
More about our data sources and methodologies.