We've gathered data and other essential information about the program, such as the average salary of graduates, ethnicity of students, how many students graduated in recent times, and more. We've also included details on how Clemson ranks compared to other colleges offering a major in engineering-related fields.
Jump to any of the following sections:
In College Factual's most recent rankings for the best schools for engineering-related fields majors, Clemson came in at #4. This puts it in the top 5% of the country in this field of study. It is also ranked #1 in South Carolina.
| Ranking Type | Rank |
|---|---|
| Best Engineering-Related Fields Schools | 4 |
| Best Engineering-Related Fields Bachelor’s Degree Schools | 4 |
During the 2021-2022 academic year, Clemson University handed out 55 bachelor's degrees in engineering-related fields. This is a decrease of 25% over the previous year when 73 degrees were handed out.
In 2022, 2 students received their master’s degree in engineering-related fields from Clemson. This makes it the #127 most popular school for engineering-related fields master’s degree candidates in the country.
In addition, 1 students received their doctoral degrees in engineering-related fields in 2022, making the school the #9 most popular school in the United States for this category of students.
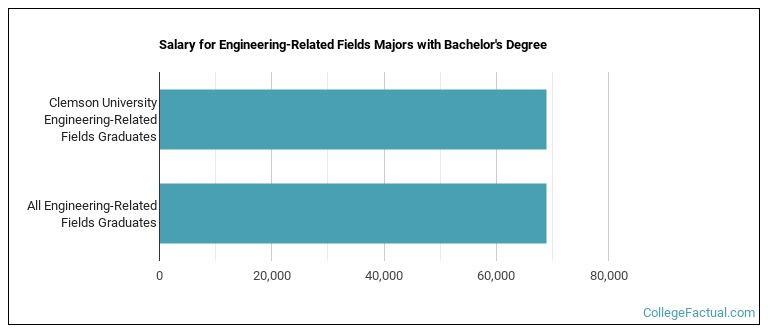
Engineering-Related Fields majors who earn their bachelor's degree from Clemson go on to jobs where they make a median salary of $68,904 a year. Unfortunately, this is lower than the national average of $68,919 for all engineering-related fields students.
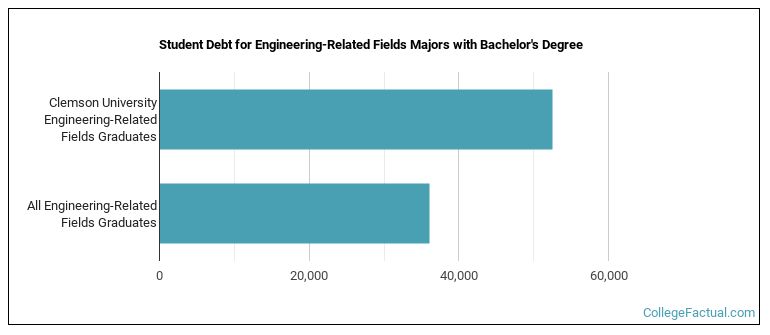
While getting their bachelor's degree at Clemson, engineering-related fields students borrow a median amount of $52,458 in student loans. This is higher than the the typical median of $36,127 for all engineering-related fields majors across the country.
During the 2022-2023 academic year, part-time undergraduate students at Clemson paid an average of $1,695 per credit hour if they came to the school from out-of-state. In-state students paid a discounted rate of $654 per credit hour. The following table shows the average full-time tuition and fees for undergraduates.
| In State | Out of State | |
|---|---|---|
| Tuition | $14,038 | $37,982 |
| Fees | $1,516 | $1,516 |
| Books and Supplies | $1,436 | $1,436 |
| On Campus Room and Board | $12,872 | $12,872 |
| On Campus Other Expenses | $5,476 | $5,476 |
Learn more about Clemson tuition and fees.
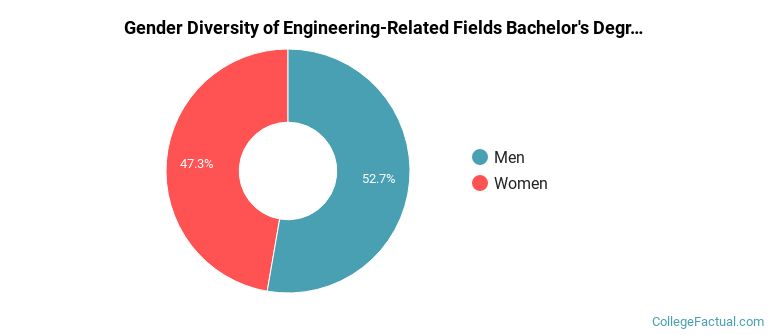
Of the 55 students who earned a bachelor's degree in Engineering-Related Fields from Clemson in 2021-2022, 53% were men and 47% were women.
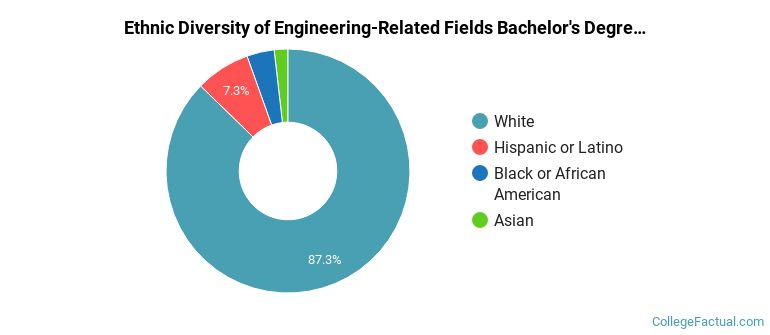
The majority of the students with this major are white. About 87% of 2022 graduates were in this category.
The following table and chart show the ethnic background for students who recently graduated from Clemson University with a bachelor's in engineering-related fields.
| Ethnic Background | Number of Students |
|---|---|
| Asian | 1 |
| Black or African American | 2 |
| Hispanic or Latino | 4 |
| White | 48 |
| Non-Resident Aliens | 0 |
| Other Races | 0 |
Clemson does not offer an online option for its engineering-related fields bachelor’s degree program at this time. To see if the school offers distance learning options in other areas, visit the Clemson Online Learning page.
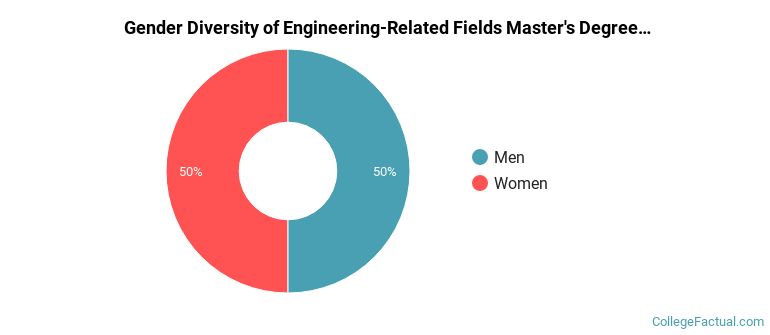
For the most recent academic year available, 50% of engineering-related fields master's degrees went to men and 50% went to women.
The majority of the students with this major are white. About 100% of 2022 graduates were in this category.
The following table and chart show the ethnic background for students who recently graduated from Clemson University with a master's in engineering-related fields.
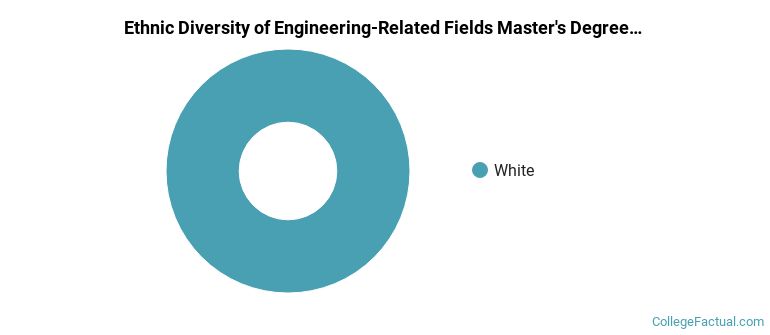
| Ethnic Background | Number of Students |
|---|---|
| Asian | 0 |
| Black or African American | 0 |
| Hispanic or Latino | 0 |
| White | 2 |
| Non-Resident Aliens | 0 |
| Other Races | 0 |
Take a look at the following statistics related to the make-up of the engineering-related fields majors at Clemson University.
| Related Major | Annual Graduates |
|---|---|
| Construction Engineering Technology | 93 |
More about our data sources and methodologies.