Below are the key facts about this program at Queens. It is offered at the Bachelor’s level, with graduate study also available. Its best result is a rank of #4 out of 33 schools (Bachelor’s level) by College Factual. Jump to any of the following sections:
College Factual ranks Queens as a strong choice for teacher education subject specific, coming in at #23 out of 554 schools nationally.
The following degree levels are available for teacher education subject specific at Queens, along with how many graduates complete each level annually.
| Degree Level | Annual Graduates |
|---|---|
| Bachelor’s | 126 |
| Master’s | 183 |
| Graduate Certificate | 119 |
| Professional Certificate | 6 |
During the most recent reporting year, CUNY Queens College awarded 126 bachelor’s degrees in teacher education subject specific.
Queens is in the top 15% of the country for teacher education subject specific at the bachelor’s level. Specifically, it ranked #4 out of 33 schools by College Factual.
Teacher Education Subject Specific students who finish a bachelor’s at Queens report a median salary of $70,234 a year. This is above $60,081, the median for all majors at Queens.
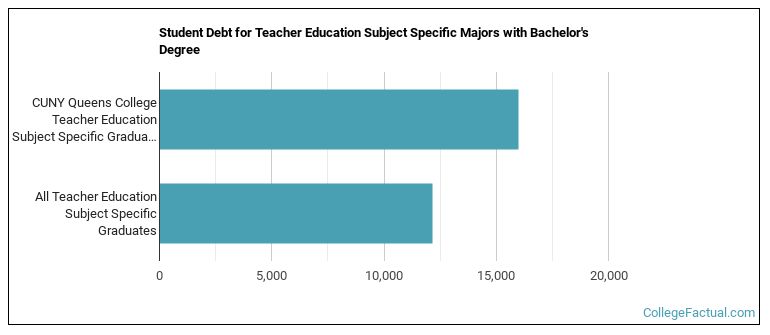
To complete a bachelor’s at Queens, teacher education subject specific students borrow a median amount of $16,000 in student loans. This is higher than $12,157, the typical median for all majors at Queens.
Average full-time tuition and fees are listed in the table below.
| In State | Out of State | |
|---|---|---|
| Tuition | $6,930 | $14,880 |
| Fees | $608 | $608 |
Learn more about Queens tuition and fees.
Among recent graduates, 40% of teacher education subject specific bachelor’s degrees went to men and 60% went to women.
 The largest share of teacher education subject specific bachelor’s degree graduates at Queens are White. About 37% of graduates fell into this category.
The following table and chart show the ethnic background for students who recently graduated from CUNY Queens College with a bachelor’s in teacher education subject specific.

| Ethnic Background | Number of Students |
|---|---|
| Asian | 23 |
| Black or African American | 10 |
| Hispanic or Latino | 36 |
| White | 47 |
| Non-Resident Aliens | 5 |
| Other Races | 5 |
Queens conferred 33 bachelor’s completions in physical education teaching and coaching in the most recent reporting year — 45% to women and 55% to men. Most of these graduates identified as White (52%).
Queens conferred 19 bachelor’s completions in social studies teacher education in the latest year of data — 42% to women and 58% to men. Most of these graduates identified as White (63%).
Queens conferred 18 bachelor’s completions in english/language arts teacher education in the latest year of data — 78% to women and 22% to men. Most of these graduates identified as Hispanic or Latino (33%).
Queens conferred 16 bachelor’s completions in mathematics teacher education in the latest year of data — 50% to women and 50% to men. The most common background among these graduates was Asian (38%).
Queens awarded 15 bachelor’s degrees in music teacher education in the most recent reporting year — 60% to women and 40% to men. The most common background among these graduates was White (33%).
Queens awarded 8 bachelor’s completions in art teacher education in the latest year of data — 62% to women and 38% to men. The most common background among these graduates was Hispanic or Latino (50%).
Queens conferred 8 bachelor’s completions in foreign language teacher education recently — 100% to women and 0% to men. The largest share of these graduates were Asian (88%).
Queens awarded 4 bachelor’s degrees in spanish language teacher education in the most recent reporting year — 100% to women and 0% to men. The largest share of these graduates were Hispanic or Latino (100%).
Queens conferred 3 bachelor’s degrees in family and consumer sciences/home economics teacher education in the most recent reporting year — 100% to women and 0% to men. The largest share of these graduates were White (67%).
Queens granted 1 bachelor’s degree in chemistry teacher education in the most recent reporting year — 100% to women and 0% to men. The largest share of these graduates were White (100%).
Queens granted 1 bachelor’s degree in earth science teacher education in the latest year of data — 100% to women and 0% to men.
Graduate study is also available at Queens. Here are the graduate award levels offered.
More about our data sources and methodologies.
