Explore the best ranked schools for the programs you are most interested in.
College Factual ranked East Central College as #2,023 out of 2,152 colleges and universities in the country on its 2025 Best Colleges list. This is an improvement over the previous year, when East Central College held the #2,151 spot on the Best Overall Colleges list.
Out of the 48 colleges in Missouri, East Central College is ranked at #44.
Since East Central College has an open admissions policy, being accepted to the school isn't that hard. However, a full basic things - such as a high school diploma or equivalent - may be required. Also, go over your application to make sure it is complete before you submit it.
With a student to faculty ratio of 14 to 1, East Central College is about average in this regard as the nationwide rate is 15 to 1. While this does not translate directly to class size, it's a good indicator of how much time professors will have to spend with their students on a one-on-one basis.
In addition to the student to faculty ratio, some people look at what percentage of faculty members are full-time as a sign of how much time professors will be able to spend with their students. This is because part-time teachers may not be be on campus as much as their full-time counterparts.
The full-time faculty percentage at East Central College is 38%. This is lower than the national average of 47%.
The freshmen retention rate tells us what percentage of first-year, full-time students choose to continue on to their sophomore year at a particular school. The rate at East Central College is 63%, which is about average when compared to the national rate of 68%.
During the 2017-2018 academic year, there were 2,593 undergraduates at East Central College with 1,145 being full-time and 1,448 being part-time.
| $0-30 K | $30K-48K | $48-75 | $75-110K | $110K + |
|---|---|---|---|---|
| $6,521 | $6,763 | $8,284 | $9,434 | $10,505 |
The net price is calculated by adding tuition, room, board and other costs and subtracting financial aid.Note that the net price is typically less than the published for a school. For more information on the sticker price of East Central College, see our tuition and fees and room and board pages.
Almost 66% of college students who graduated with the class of 2018 took out student loans, but that percentage varies from school to school. At East Central College, approximately 5% of students took out student loans averaging $4,800 a year. That adds up to $19,200 over four years for those students.
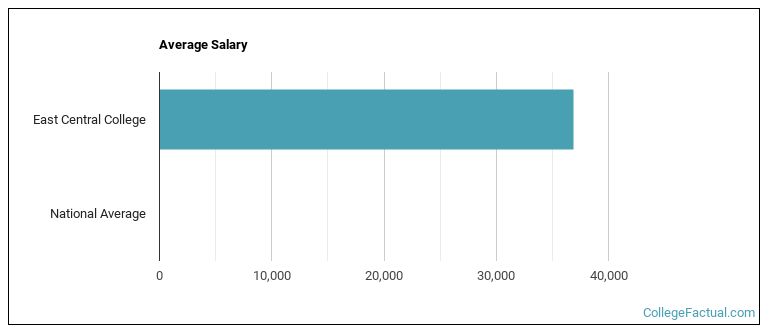
See which majors at East Central College make the most money.
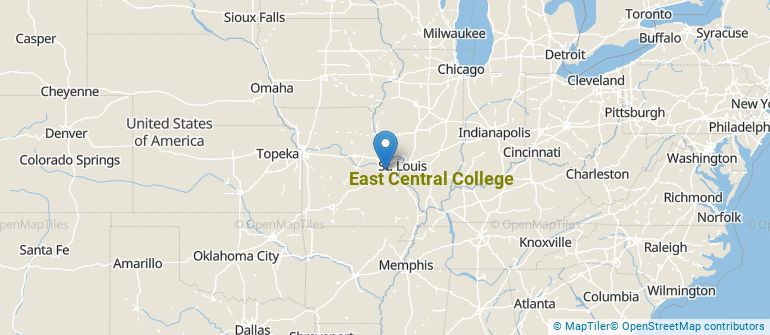
Get more details about the location of East Central College.
Contact details for East Central College are given below.
| Contact Details | |
|---|---|
| Address: | 1964 Prairie Dell Rd, Union, MO 63084 |
| Phone: | 636-584-6500 |
| Website: | www.eastcentral.edu/ |
| Most Popular Majors | Bachelor’s Degrees | Average Salary of Graduates |
|---|---|---|
| Liberal Arts General Studies | 249 | NA |
| Precision Metal Working | 49 | NA |
| Nursing | 42 | NA |
| Culinary Arts | 33 | NA |
| Teacher Education Subject Specific | 31 | NA |
| Heating, Air Conditioning, Ventilation & Refrigeration | 27 | NA |
| Allied Health Professions | 21 | NA |
| Allied Health & Medical Assisting Services | 17 | NA |
| General Engineering | 15 | NA |
| Health & Medical Administrative Services | 14 | NA |
Online learning options are becoming more and more popular at American colleges and universities. Online classes are great for students who have busy schedules or for those who just want to study on their own time.
In 2022-2023, 1,233 students took at least one online class at East Central College. This is a decrease from the 1,273 students who took online classes the previous year.
| Year | Took at Least One Online Class | Took All Classes Online |
|---|---|---|
| 2022-2023 | 1,233 | 473 |
| 2021-2022 | 1,273 | 496 |
| 2020-2021 | 1,268 | 507 |
| 2018-2019 | 1,063 | 335 |
Footnotes
*The racial-ethnic minorities count is calculated by taking the total number of students and subtracting white students, international students, and students whose race/ethnicity was unknown. This number is then divided by the total number of students at the school to obtain the racial-ethnic minorities percentage.
References
More about our data sources and methodologies.