College Factual recognizes the best colleges and universities in its annual rankings. These rankings include categories for best overall colleges, best colleges for each major, best value schools, and much more.
Farmingdale State College was awarded 33 badges in the 2025 rankings. The highest ranked major at the school is mechanical engineering technology.
Explore the best ranked schools for the programs you are most interested in.
SUNY College of Technology at Farmingdale landed the #1,189 spot in College Factual's 2025 ranking of best overall colleges in the United States. The higher ed experts analyzed 2,152 colleges and universities across the nation to determine this ranking. This is an improvement over the previous year, when SUNY College of Technology at Farmingdale held the #1,540 spot on the Best Overall Colleges list.
SUNY College of Technology at Farmingdale is also ranked #107 out of 136 schools in New York.
The acceptance rate at Farmingdale State College is 73%. That's higher than the rate at many schools, but still low enough to be considered somewhat selective. If you want to get in, you'll need good grades and to be able to show that SUNY College of Technology at Farmingdale is a good fit for you.
About 39% of students accepted to SUNY College of Technology at Farmingdale submitted their SAT scores. When looking at the 25th through the 75th percentile, SAT Evidence-Based Reading and Writing scores ranged between 500 and 588. Math scores were between 500 and 590.
The student to faculty ratio at Farmingdale State College is about average at 18 to 1. This ratio is often used to gauge how many students might be in an average class and how much time professors will have to spend with their students on an individual level. The national average for this metric is 15 to 1.
In addition to the student to faculty ratio, some people look at what percentage of faculty members are full-time as a sign of how much time professors will be able to spend with their students. This is because part-time teachers may not be be on campus as much as their full-time counterparts.
The full-time faculty percentage at Farmingdale State College is 33%. This is lower than the national average of 47%.
Farmingdale State College has a freshmen retention rate of 81%. That's a good sign that full-time students like the school and their professors enough to want to stick around for another year. It's also a sign that the admissions team did a good job in choosing applicants who were a good fit for the school.
The on-time graduation rate is the percent of first-time, full-time students who get their bachelor's degree with four years. At SUNY College of Technology at Farmingdale this rate is 32%, which is about average when compared to the national rate of 33.3%.
Find out more about the retention and graduation rates at Farmingdale State College.
During the 2017-2018 academic year, there were 9,948 undergraduates at SUNY College of Technology at Farmingdale with 7,860 being full-time and 2,088 being part-time.
| $0-30 K | $30K-48K | $48-75 | $75-110K | $110K + |
|---|---|---|---|---|
| $3,294 | $5,777 | $10,235 | $13,361 | $15,922 |
The net price is calculated by adding tuition, room, board and other costs and subtracting financial aid.Note that the net price is typically less than the published for a school. For more information on the sticker price of SUNY College of Technology at Farmingdale, see our tuition and fees and room and board pages.
Almost 66% of college students who graduated with the class of 2018 took out student loans, but that percentage varies from school to school. At SUNY College of Technology at Farmingdale, approximately 26% of students took out student loans averaging $5,276 a year. That adds up to $21,104 over four years for those students.
The student loan default rate at SUNY College of Technology at Farmingdale is 1.0%. This is significantly lower than the national default rate of 10.1%, which is a good sign that you'll be able to pay back your student loans.
Get more details about paying for Farmingdale State College.
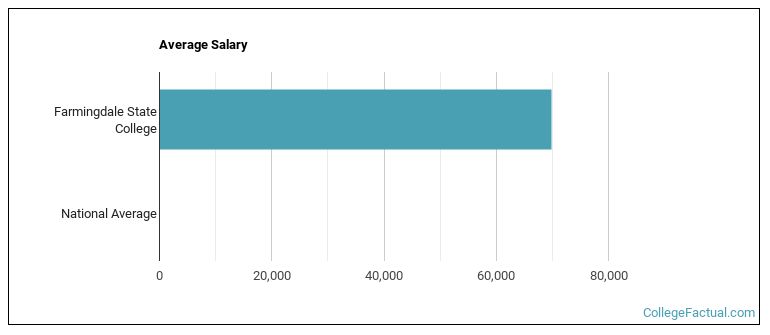
See which majors at Farmingdale State College make the most money.
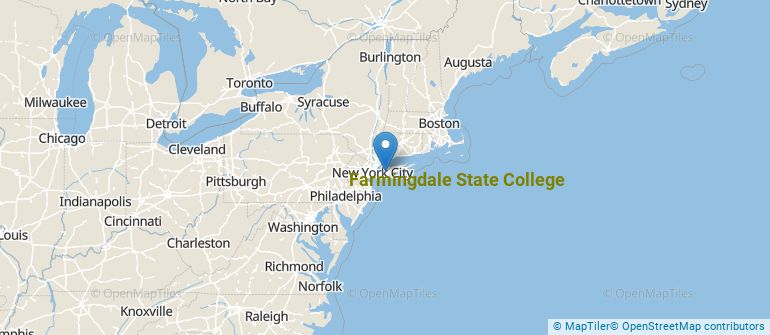
Get more details about the location of Farmingdale State College.
Contact details for SUNY College of Technology at Farmingdale are given below.
| Contact Details | |
|---|---|
| Address: | 2350 Broadhollow Road, Farmingdale, NY 11735-1021 |
| Phone: | 934-420-2000 |
| Website: | www.farmingdale.edu/ |
| Most Popular Majors | Bachelor’s Degrees | Average Salary of Graduates |
|---|---|---|
| Business Administration & Management | 376 | $39,290 |
| Science, Technology & Society | 267 | $31,638 |
| Liberal Arts General Studies | 187 | NA |
| Security Science and Technology | 180 | $38,789 |
| Computer Programming | 136 | $45,383 |
| Nursing | 82 | $103,508 |
| Mechanical Engineering Technology | 81 | $62,223 |
| General Biology | 62 | $34,245 |
| Construction Engineering Technology | 59 | $69,942 |
| Clinical, Counseling & Applied Psychology | 55 | $28,904 |
Online learning options are becoming more and more popular at American colleges and universities. Online classes are great for students who have busy schedules or for those who just want to study on their own time.
In 2022-2023, 3,889 students took at least one online class at Farmingdale State College. This is a decrease from the 6,043 students who took online classes the previous year.
| Year | Took at Least One Online Class | Took All Classes Online |
|---|---|---|
| 2022-2023 | 3,889 | 554 |
| 2021-2022 | 6,043 | 1,061 |
| 2020-2021 | 9,928 | 6,365 |
| 2018-2019 | 2,252 | 263 |
Learn more about online learning at Farmingdale State College.
If you’re considering Farmingdale State College, here are some more schools you may be interested in knowing more about.
Curious on how these schools stack up against SUNY College of Technology at Farmingdale? Pit them head to head with College Combat, our free interactive tool that lets you compare college on the features that matter most to you!
Footnotes
*The racial-ethnic minorities count is calculated by taking the total number of students and subtracting white students, international students, and students whose race/ethnicity was unknown. This number is then divided by the total number of students at the school to obtain the racial-ethnic minorities percentage.
References
More about our data sources and methodologies.