College Factual analyzes over 2,000 colleges and universities in its annual rankings and ranks them in a variety of ways, including most diverse, best overall quality, best for non-traditional students, and much more.
Goddard College was awarded 4 badges in the 2025 rankings. The highest ranked major at the school is general education.
Explore the best ranked schools for the programs you are most interested in.
Goddard College is also ranked #8 out of 9 schools in Vermont.
Goddard College was not ranked in College Factual's 2025 Best Overall Colleges report. This could be for a number of reasons, including lack of data.
With an acceptance rate of 86%, Goddard College has a fairly liberal admissions policy. However, don't just assume you'll get in! Put together a good application and make sure you include all requested documents and materials.
The student to faculty ratio at Goddard College is an impressive 6 to 1. That's quite good when you compare it to the national average of 15 to 1. This is a good sign that students at the school will have more opportunities for one-on-one interactions with their professors.
Another measure that is often used to estimate how much access students will have to their professors is how many faculty members are full-time. The idea here is that part-time faculty tend to spend less time on campus, so they may not be as available to students as full-timers.
The full-time faculty percentage at Goddard College is 90%. This is higher than the national average of 47%.
The freshmen retention rate of 80% tells us that most first-year, full-time students like Goddard College enough to come back for another year. This is a fair bit higher than the national average of 68%. That's certainly something to check off in the good column about the school.
The on-time graduation rate is the percent of first-time, full-time students who get their bachelor's degree with four years. At Goddard College this rate is 29%, which is about average when compared to the national rate of 33.3%.
Find out more about the retention and graduation rates at Goddard College.
During the 2017-2018 academic year, there were 155 undergraduates at Goddard College with 134 being full-time and 21 being part-time.
The net price is calculated by adding tuition, room, board and other costs and subtracting financial aid.Note that the net price is typically less than the published for a school. For more information on the sticker price of Goddard College, see our tuition and fees and room and board pages.
It's not uncommon for college students to take out loans to pay for school. In fact, almost 66% of students nationwide depend at least partially on loans. At Goddard College, approximately 17% of students took out student loans averaging $5,500 a year. That adds up to $22,000 over four years for those students.
The student loan default rate at Goddard College is 1.0%. This is significantly lower than the national default rate of 10.1%, which is a good sign that you'll be able to pay back your student loans.
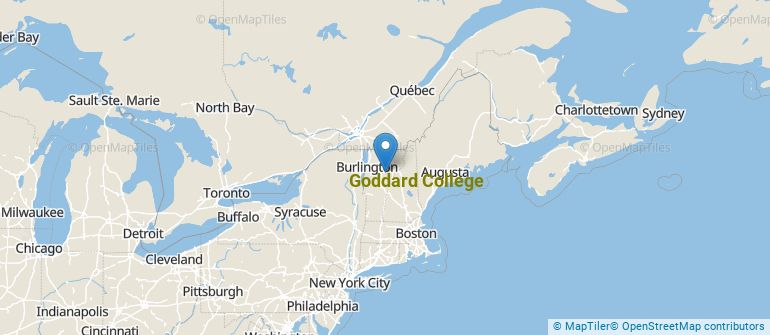
Get more details about the location of Goddard College.
Contact details for Goddard College are given below.
| Contact Details | |
|---|---|
| Address: | 123 Pitkin Road, Plainfield, VT 05667-9432 |
| Phone: | 802-454-8311 |
| Website: | www.goddard.edu/ |
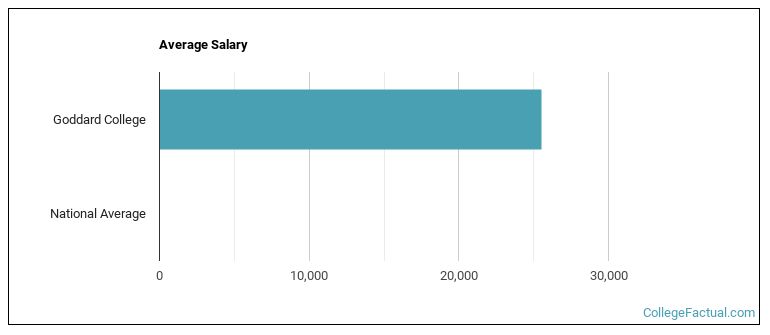
| Most Popular Majors | Bachelor’s Degrees | Average Salary of Graduates |
|---|---|---|
| Liberal Arts General Studies | 41 | $19,331 |
| General Education | 33 | $56,397 |
| Other Visual Art | 24 | NA |
| Writing Studies | 22 | NA |
| Clinical, Counseling & Applied Psychology | 9 | NA |
| Community/Environmental/Socially-Engaged Art | 4 | NA |
| General Psychology | 2 | NA |
| Multilingual Education | 0 | NA |
| Student Counseling | 0 | NA |
| Teacher Education Subject Specific | 0 | NA |
Online learning is becoming popular at even the oldest colleges and universities in the United States. Not only are online classes great for returning adults with busy schedules, they are also frequented by a growing number of traditional students.
In 2022-2023, 320 students took at least one online class at Goddard College. This is an increase from the 0 students who took online classes the previous year.
| Year | Took at Least One Online Class | Took All Classes Online |
|---|---|---|
| 2022-2023 | 320 | 320 |
| 2021-2022 | 0 | 0 |
| 2020-2021 | 0 | 0 |
| 2018-2019 | 0 | 0 |
Footnotes
*The racial-ethnic minorities count is calculated by taking the total number of students and subtracting white students, international students, and students whose race/ethnicity was unknown. This number is then divided by the total number of students at the school to obtain the racial-ethnic minorities percentage.
References
More about our data sources and methodologies.