Jump to any of the following sections:
In College Factual's most recent rankings for the best schools for social sciences majors, Harvard came in at #10. This puts it in the top 5% of the country in this field of study. It is also ranked #1 in Massachusetts.
During the 2021-2022 academic year, Harvard University handed out 557 bachelor's degrees in social sciences. This is an increase of 16% over the previous year when 481 degrees were handed out.
In 2022, 218 students received their master’s degree in social sciences from Harvard. This makes it the #11 most popular school for social sciences master’s degree candidates in the country.
In addition, 77 students received their doctoral degrees in social sciences in 2022, making the school the #2 most popular school in the United States for this category of students.
In 2022-2023, the average part-time undergraduate tuition at Harvard was $1,696 per credit hour for both in-state and out-of-state students. The average full-time tuition and fees for undergraduates are shown in the table below.
| In State | Out of State | |
|---|---|---|
| Tuition | $54,269 | $54,269 |
| Fees | $4,807 | $4,807 |
| Books and Supplies | $1,000 | $1,000 |
| On Campus Room and Board | $20,374 | $20,374 |
| On Campus Other Expenses | $6,255 | $6,255 |
Learn more about Harvard tuition and fees.
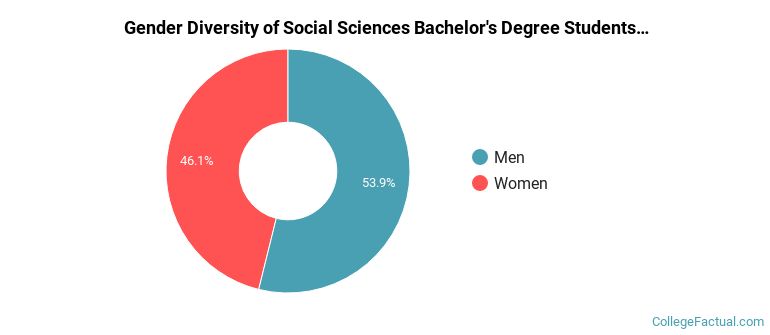
Of the 557 students who graduated with a Bachelor’s in social sciences from Harvard in 2022, 54% were men and 46% were women.
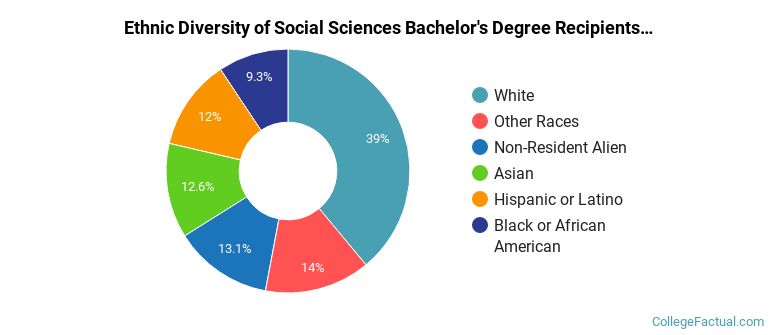
The following table and chart show the ethnic background for students who recently graduated from Harvard University with a bachelor's in social sciences.
| Ethnic Background | Number of Students |
|---|---|
| Asian | 70 |
| Black or African American | 52 |
| Hispanic or Latino | 67 |
| White | 217 |
| Non-Resident Aliens | 73 |
| Other Races | 78 |
Online degrees for the Harvard social sciences bachelor’s degree program are not available at this time. To see if the school offers distance learning options in other areas, visit the Harvard Online Learning page.
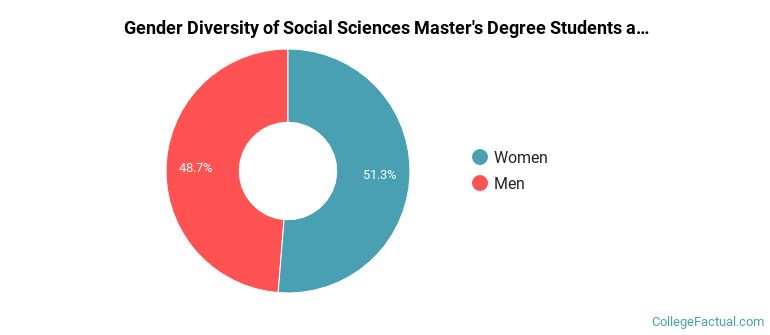
The social sciences program at Harvard awarded 273 master's degrees in 2021-2022. About 49% of these degrees went to men with the other 51% going to women.
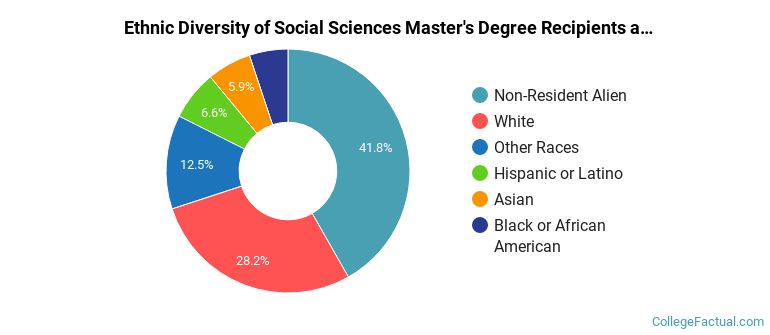
The following table and chart show the ethnic background for students who recently graduated from Harvard University with a master's in social sciences.
| Ethnic Background | Number of Students |
|---|---|
| Asian | 16 |
| Black or African American | 14 |
| Hispanic or Latino | 18 |
| White | 77 |
| Non-Resident Aliens | 114 |
| Other Races | 34 |
Take a look at the following statistics related to the make-up of the social sciences majors at Harvard University.
Social Sciences students may decide to major in one of the following focus areas. Individual majors may not be available for all degree levels.
| Major | Annual Graduates |
|---|---|
| Economics | 332 |
| General Social Sciences | 195 |
| Political Science & Government | 191 |
| International Relations & National Security | 171 |
| Sociology | 65 |
| Anthropology | 53 |
| Related Major | Annual Graduates |
|---|---|
| History | 228 |
| Area, Ethnic, Culture, & Gender Studies | 133 |
| Theology & Religious Vocations | 131 |
| English Language & Literature | 124 |
| Philosophy & Religious Studies | 122 |
More about our data sources and methodologies.