We've gathered data and other essential information about the program, such as the average salary of graduates, ethnicity of students, how many students graduated in recent times, and more. In addition, we cover how Indiana State ranks in comparison to other schools with me tech programs.
Jump to any of the following sections:
The bachelor's program at Indiana State was ranked #23 on College Factual's Best Schools for me tech list. It is also ranked #3 in Indiana.
| Ranking Type | Rank |
|---|---|
| Best Mechanical Engineering Technology Bachelor’s Degree Schools | 11 |
| Best Mechanical Engineering Technology Schools | 23 |
During the 2021-2022 academic year, Indiana State University handed out 70 bachelor's degrees in mechanical engineering technology. This is an increase of 3% over the previous year when 68 degrees were handed out.
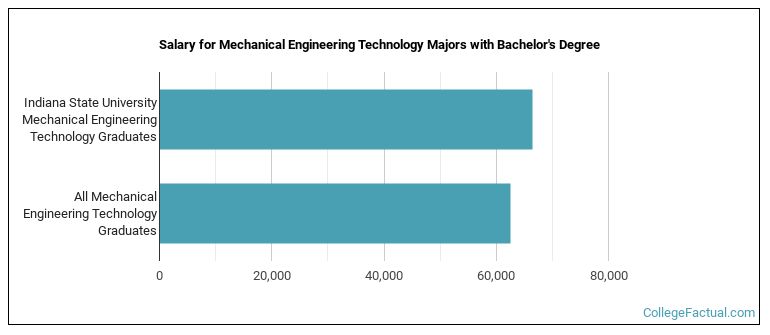
ME Tech majors who earn their bachelor's degree from Indiana State go on to jobs where they make a median salary of $66,479 a year. This is great news for graduates of the program, since this figure is higher than the national average of $62,554 for all me tech bachelor's degree recipients.
While getting their bachelor's degree at Indiana State, me tech students borrow a median amount of $30,746 in student loans. This is higher than the the typical median of $23,971 for all me tech majors across the country.
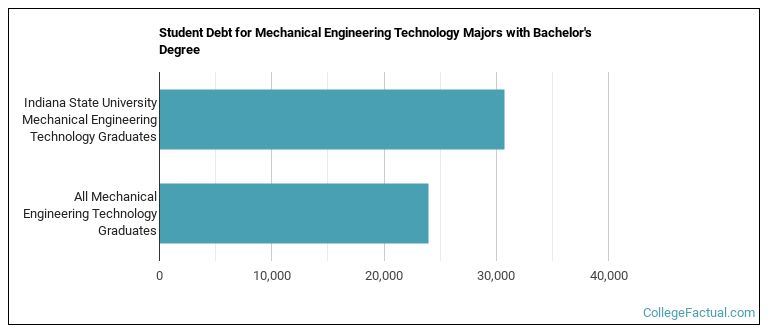
The typical student loan payment of a bachelor's degree student from the me tech program at Indiana State is $252 per month.
In 2022-2023, the average part-time undergraduate tuition at Indiana State was $758 per credit hour for out-of-state students. The average for in-state students was $351 per credit hour. The average full-time tuition and fees for undergraduates are shown in the table below.
| In State | Out of State | |
|---|---|---|
| Tuition | $9,712 | $21,454 |
| Fees | $280 | $280 |
| Books and Supplies | $1,200 | $1,200 |
| On Campus Room and Board | $11,483 | $11,483 |
| On Campus Other Expenses | $2,380 | $2,380 |
Learn more about Indiana State tuition and fees.
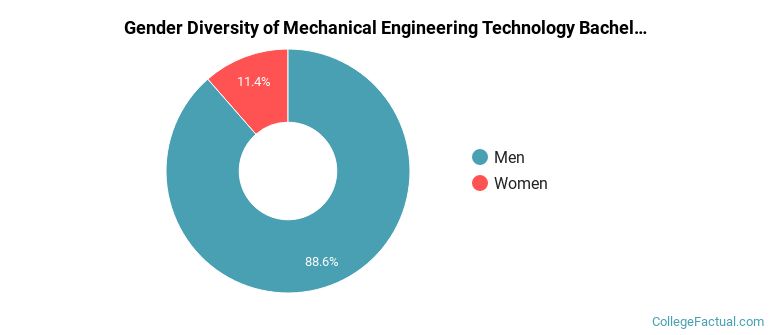
For the most recent academic year available, 89% of me tech bachelor's degrees went to men and 11% went to women.
The majority of bachelor's degree recipients in this major at Indiana State are white. In the most recent graduating class for which data is available, 80% of students fell into this category.
The following table and chart show the ethnic background for students who recently graduated from Indiana State University with a bachelor's in me tech.
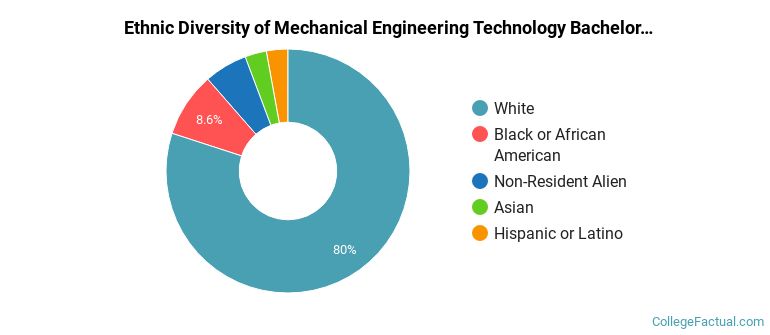
| Ethnic Background | Number of Students |
|---|---|
| Asian | 2 |
| Black or African American | 6 |
| Hispanic or Latino | 2 |
| White | 56 |
| Non-Resident Aliens | 4 |
| Other Races | 0 |
Online degrees for the Indiana State me tech bachelor’s degree program are not available at this time. To see if the school offers distance learning options in other areas, visit the Indiana State Online Learning page.
Take a look at the following statistics related to the make-up of the me tech majors at Indiana State University.
| Related Major | Annual Graduates |
|---|---|
| Quality Control Technology | 30 |
| Industrial Production Technology | 21 |
| Electronics Engineering Technology | 19 |
| Computer Engineering Technology | 15 |
| Civil Engineering Technology | 8 |
More about our data sources and methodologies.