We've pulled together some essential information you should know about the program, including how many students graduate each year, the ethnic diversity of these students, and more. In addition, we cover how ICC ranks in comparison to other schools with subject specific ed programs.
Jump to any of the following sections:
The bachelor's program at ICC was ranked #360 on College Factual's Best Schools for subject specific ed list.
Out-of-state part-time undergraduates at ICC paid an average of $245 per credit hour in 2022-2023. The average for in-state students was $145 per credit hour. Information about average full-time undergraduate tuition and fees is shown in the table below.
| In State | Out of State | |
|---|---|---|
| Tuition | $3,100 | $5,500 |
| Fees | $320 | $320 |
| Books and Supplies | $1,450 | $1,450 |
| On Campus Room and Board | $4,725 | $4,725 |
| On Campus Other Expenses | $2,840 | $2,840 |
Learn more about ICC tuition and fees.
ICC does not offer an online option for its subject specific ed bachelor’s degree program at this time. To see if the school offers distance learning options in other areas, visit the ICC Online Learning page.
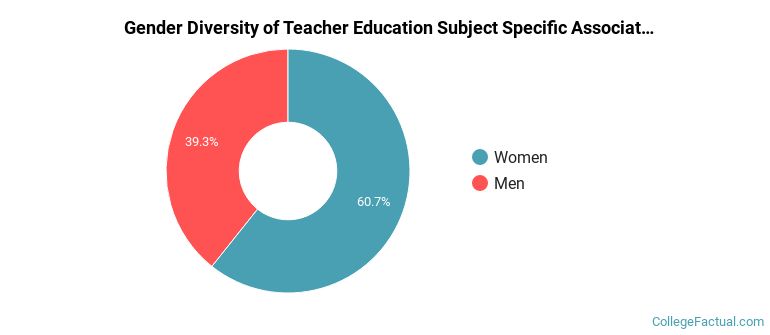
During the 2021-2022 academic year, 28 students graduated with a associate's degree in subject specific ed from ICC. About 39% were men and 61% were women.
The majority of the students with this major are white. About 68% of 2022 graduates were in this category.
The following table and chart show the ethnic background for students who recently graduated from Itawamba Community College with a associate's in subject specific ed.
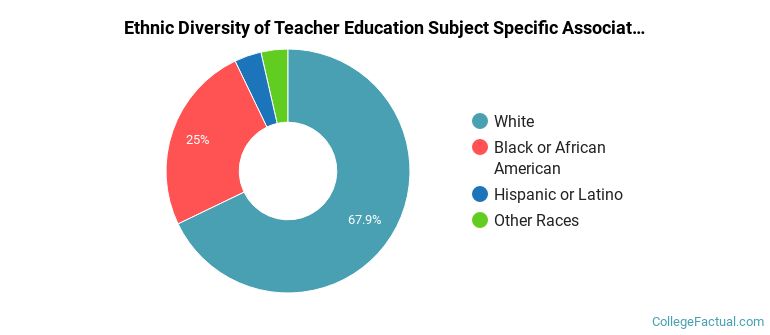
| Ethnic Background | Number of Students |
|---|---|
| Asian | 0 |
| Black or African American | 7 |
| Hispanic or Latino | 1 |
| White | 19 |
| Non-Resident Aliens | 0 |
| Other Races | 1 |
| Related Major | Annual Graduates |
|---|---|
| Teacher Education Grade Specific | 47 |
| Special Education | 2 |
View All Teacher Education Subject Specific Related Majors >