Here, you'll find out more about the major, including such details as the number of graduates, what degree levels are offered, ethnicity of students, average salaries, and more. We've also included details on how KSU Georgia ranks compared to other colleges offering a major in subject specific ed.
Jump to any of the following sections:
The bachelor's program at KSU Georgia was ranked #122 on College Factual's Best Schools for subject specific ed list. It is also ranked #3 in Georgia.
During the 2021-2022 academic year, Kennesaw State University handed out 86 bachelor's degrees in teacher education subject specific. This is an increase of 1% over the previous year when 85 degrees were handed out.
In 2022, 8 students received their master’s degree in subject specific ed from KSU Georgia. This makes it the #358 most popular school for subject specific ed master’s degree candidates in the country.
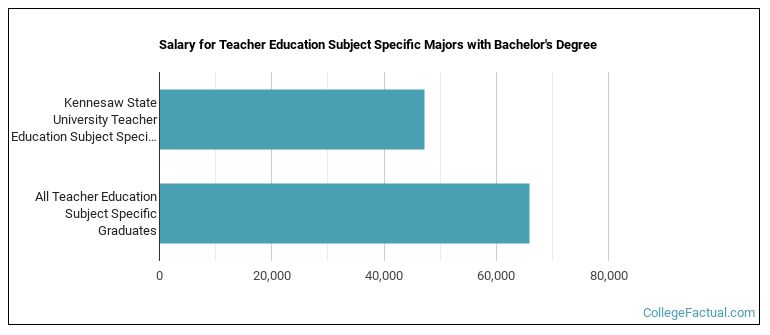
Subject Specific Ed majors who earn their bachelor's degree from KSU Georgia go on to jobs where they make a median salary of $45,243 a year. This is great news for graduates of the program, since this figure is higher than the national average of $43,086 for all subject specific ed bachelor's degree recipients.
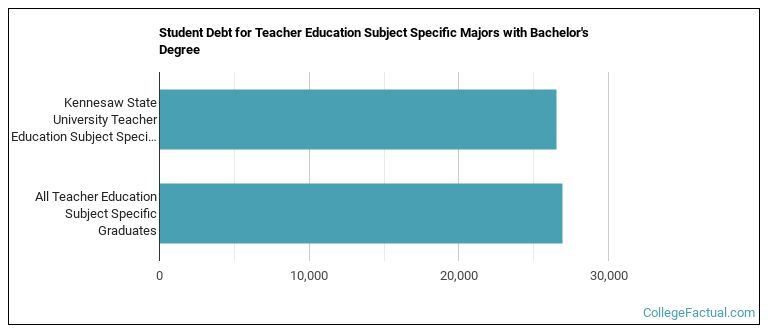
While getting their bachelor's degree at KSU Georgia, subject specific ed students borrow a median amount of $31,846 in student loans. This is higher than the the typical median of $26,530 for all subject specific ed majors across the country.
In 2022-2023, the average part-time undergraduate tuition at KSU Georgia was $654 per credit hour for out-of-state students. The average for in-state students was $185 per credit hour.
The following table shows the average full-time tuition and fees for undergraduates.In State Out of State Tuition $4,450 $15,704 Fees $1,336 $1,336 Books and Supplies $1,500 $1,500 On Campus Room and Board $13,027 $13,027 On Campus Other Expenses $5,614 $5,614
Learn more about KSU Georgia tuition and fees.
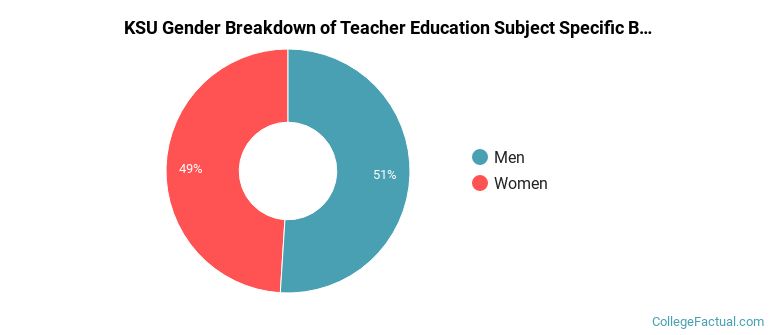
In the 2021-2022 academic year, 86 students earned a bachelor's degree in subject specific ed from KSU Georgia. About 51% of these graduates were women and the other 49% were men.
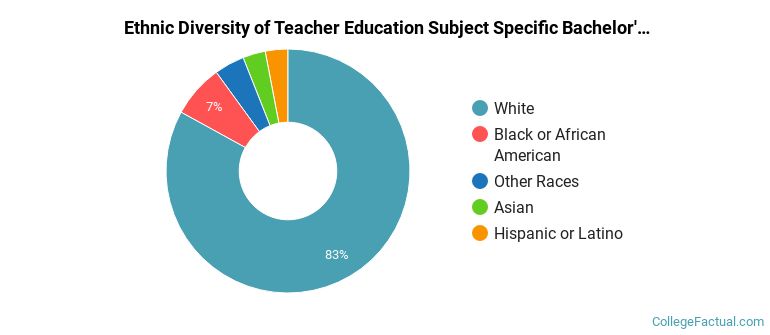
The majority of bachelor's degree recipients in this major at KSU Georgia are white. In the most recent graduating class for which data is available, 72% of students fell into this category.
The following table and chart show the ethnic background for students who recently graduated from Kennesaw State University with a bachelor's in subject specific ed.
| Ethnic Background | Number of Students |
|---|---|
| Asian | 1 |
| Black or African American | 4 |
| Hispanic or Latino | 10 |
| White | 62 |
| Non-Resident Aliens | 1 |
| Other Races | 8 |
KSU Georgia does not offer an online option for its subject specific ed bachelor’s degree program at this time. To see if the school offers distance learning options in other areas, visit the KSU Georgia Online Learning page.
All of the 15 students who graduated with a Master’s in subject specific ed from KSU Georgia in 2022 were women.

The majority of the students with this major are white. About 60% of 2022 graduates were in this category.
The following table and chart show the ethnic background for students who recently graduated from Kennesaw State University with a master's in subject specific ed.
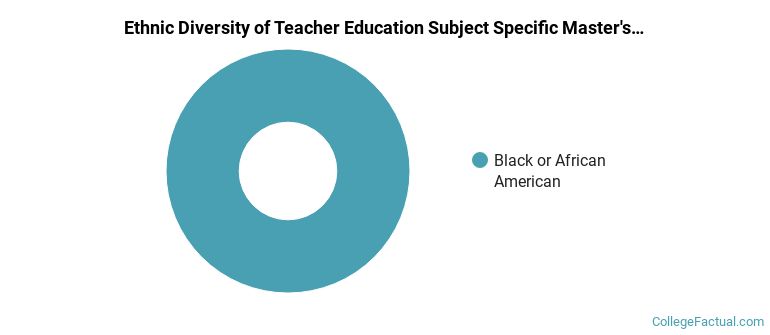
| Ethnic Background | Number of Students |
|---|---|
| Asian | 0 |
| Black or African American | 4 |
| Hispanic or Latino | 1 |
| White | 9 |
| Non-Resident Aliens | 0 |
| Other Races | 1 |
Take a look at the following statistics related to the make-up of the subject specific ed majors at Kennesaw State University.
| Related Major | Annual Graduates |
|---|---|
| Teacher Education Grade Specific | 507 |
| Instructional Media Design | 193 |
| Curriculum & Instruction | 56 |
| Educational Administration | 51 |
| Special Education | 12 |
View All Teacher Education Subject Specific Related Majors >