Below are the key facts about this program at KSU. It is offered at the Bachelor’s level. Its best result is a rank of #3 out of 6 schools (Bachelor’s level) by College Factual. Jump to any of the following sections:
College Factual rates KSU among the top schools in the country for music, coming in at #292 out of 416 schools nationally.
| Ranking | Rank |
|---|---|
| Best Music Schools | 292 of 416 |
| Best Music Schools in Georgia | 3 of 7 |
| Best Music Schools in the Southeast Region | 60 of 98 |
The following degree levels are available for music at KSU, along with how many graduates complete each level annually.
| Degree Level | Annual Graduates |
|---|---|
| Bachelor’s | 32 |
For the most recent IPEDS reporting year, Kennesaw State University awarded 32 bachelor’s degrees in music.
KSU is a solid choice among schools offering music at the bachelor’s level. In particular it placed #3 out of 6 schools by College Factual.
| Ranking | Rank |
|---|---|
| Best Music Bachelor’s Degree Schools in Georgia | 3 |
| Best Music Bachelor’s Degree Schools in the Southeast Region | 57 |
| Best Music Bachelor’s Degree Schools | 273 |
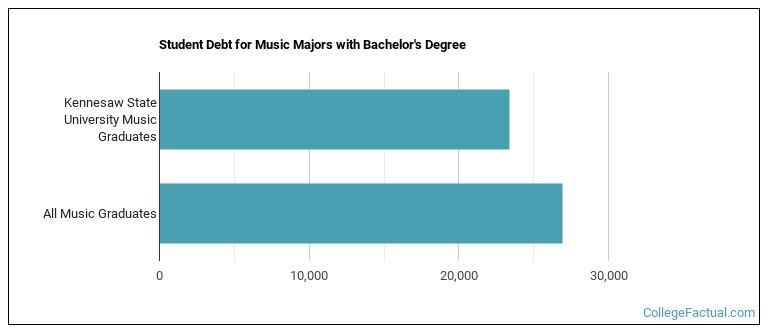
While getting their bachelor’s degree at KSU, music students borrow a median amount of $23,400 in student loans. This is lower than $26,930, the typical median for all majors at KSU.
Average full-time tuition and fees are listed in the table below.
| In State | Out of State | |
|---|---|---|
| Tuition | $4,450 | $16,488 |
| Fees | $1,248 | $1,248 |
Read more about KSU tuition and fees.
For the most recent academic year available, 69% of music bachelor’s degrees went to men and 31% went to women.
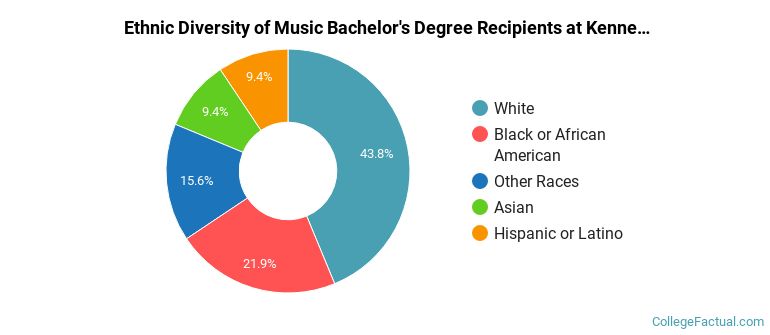
 The largest share of music bachelor’s degree graduates at KSU were White. Approximately 44% of graduates fell into this category.
The following table and chart show the ethnic background for students who recently graduated from Kennesaw State University with a bachelor’s in music.
| Ethnic Background | Number of Students |
|---|---|
| Asian | 3 |
| Black or African American | 7 |
| Hispanic or Latino | 3 |
| White | 14 |
| Non-Resident Aliens | 0 |
| Other Races | 5 |
KSU granted 20 bachelor’s completions in music performance, general in the most recent reporting year — 35% to women and 65% to men. Most of these graduates identified as White (35%).
More about our data sources and methodologies.