Go directly to any of the following sections:
The bachelor's program at Kent State University at Ashtabula was ranked #407 on College Factual's Best Schools for liberal arts / sciences & humanities list. It is also ranked #16 in Ohio.
| Ranking Type | Rank |
|---|---|
| Best Liberal Arts / Sciences & Humanities Associate Degree Schools | 262 |
| Best Liberal Arts / Sciences & Humanities Schools | 407 |
During the 2021-2022 academic year, Kent State University at Ashtabula handed out 8 bachelor's degrees in liberal arts / sciences & humanities. This is a decrease of 27% over the previous year when 11 degrees were handed out.
Learn about other programs related to Liberal Arts / Sciences & Humanities that might interest you.
Maximize your transfer credits and complete your bachelor's degree faster with this flexible online bachelor's from Southern New Hampshire University.
Out-of-state part-time undergraduates at Kent State University at Ashtabula paid an average of $713 per credit hour in 2022-2023. The average for in-state students was $333 per credit hour. Information about average full-time undergraduate tuition and fees is shown in the table below.
| In State | Out of State | |
|---|---|---|
| Tuition | $7,325 | $16,438 |
| Fees | $103 | $103 |
| Books and Supplies | $1,200 | $1,200 |
Learn more about Kent State University at Ashtabula tuition and fees.
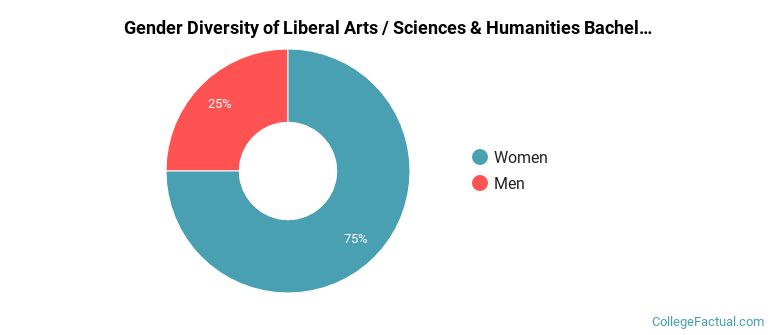
Of the 8 students who graduated with a Bachelor’s in liberal arts / sciences & humanities from Kent State University at Ashtabula in 2022, 25% were men and 75% were women.
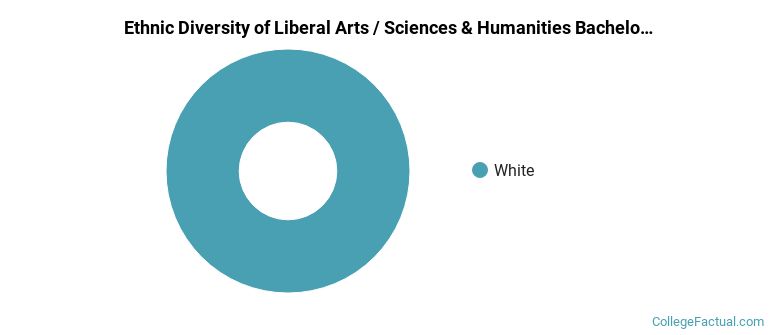
The majority of bachelor's degree recipients in this major at Kent State University at Ashtabula are white. In the most recent graduating class for which data is available, 100% of students fell into this category.
The following table and chart show the ethnic background for students who recently graduated from Kent State University at Ashtabula with a bachelor's in liberal arts / sciences & humanities.
| Ethnic Background | Number of Students |
|---|---|
| Asian | 0 |
| Black or African American | 0 |
| Hispanic or Latino | 0 |
| White | 8 |
| Non-Resident Aliens | 0 |
| Other Races | 0 |
If you’re interested in online learning, you’re in luck. Kent State University at Ashtabula does offer online classes in its liberal arts / sciences & humanities bachelor’s degree program. To see if the school offers distance learning options in other areas, visit the Kent State University at Ashtabula Online Learning page.
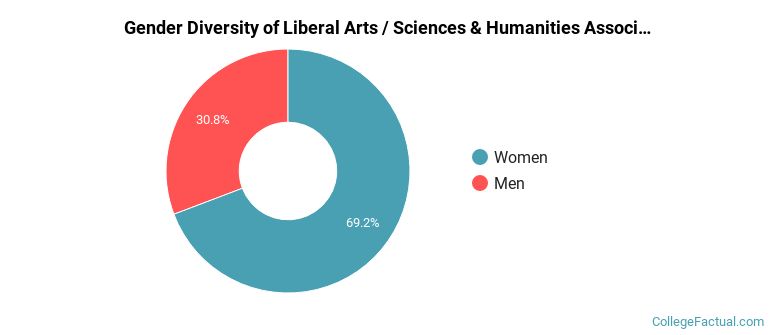
During the 2021-2022 academic year, 52 students graduated with a associate's degree in liberal arts / sciences & humanities from Kent State University at Ashtabula. About 31% were men and 69% were women.
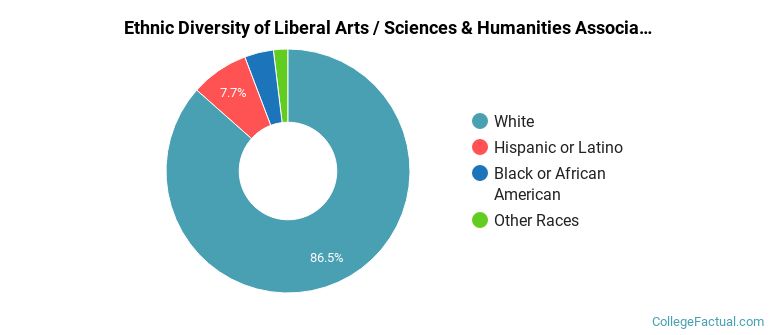
The majority of associate's degree recipients in this major at Kent State University at Ashtabula are white. In the most recent graduating class for which data is available, 87% of students fell into this category.
The following table and chart show the ethnic background for students who recently graduated from Kent State University at Ashtabula with a associate's in liberal arts / sciences & humanities.
| Ethnic Background | Number of Students |
|---|---|
| Asian | 0 |
| Black or African American | 2 |
| Hispanic or Latino | 4 |
| White | 45 |
| Non-Resident Aliens | 0 |
| Other Races | 1 |
Take a look at the following statistics related to the make-up of the liberal arts / sciences & humanities majors at Kent State University at Ashtabula.
Liberal Arts / Sciences & Humanities students may decide to major in one of the following focus areas. Individual majors may not be available for all degree levels.
| Major | Annual Graduates |
|---|---|
| Liberal Arts General Studies | 60 |
