Explore the best ranked schools for the programs you are most interested in.
LCAD was not ranked in College Factual's Best Overall Colleges report this year. This may be because not enough data was available.
See all of the rankings for Laguna College of Art and Design.
The acceptance rate at Laguna College of Art and Design is 88%, which is higher than many other schools to which you may be applying. But don't think getting into LCAD is a sure thing. The admissions staff is still going to review your application to see if you are a good fit for the school.
The student to faculty ratio at LCAD is an impressive 9 to 1. That's quite good when you compare it to the national average of 15 to 1. This is a good sign that students at the school will have more opportunities for one-on-one interactions with their professors.
In addition to the student to faculty ratio, some people look at what percentage of faculty members are full-time as a sign of how much time professors will be able to spend with their students. This is because part-time teachers may not be be on campus as much as their full-time counterparts.
The full-time faculty percentage at Laguna College of Art and Design is 13%. This is lower than the national average of 47%.
Laguna College of Art and Design has a freshmen retention rate of 79%. That's a good sign that full-time students like the school and their professors enough to want to stick around for another year. It's also a sign that the admissions team did a good job in choosing applicants who were a good fit for the school.
Students are considered to have graduated on time if they finish their studies within four years. At LCAD the on-time graduation rate of first-time, full-time students is 44%. That is great when compared to the national average of 33.3%
Find out more about the retention and graduation rates at Laguna College of Art and Design.
During the 2017-2018 academic year, there were 732 undergraduates at LCAD with 635 being full-time and 97 being part-time.
| $0-30 K | $30K-48K | $48-75 | $75-110K | $110K + |
|---|---|---|---|---|
| $34,814 | $38,162 | $38,758 | $41,298 | $44,684 |
The net price is calculated by adding tuition, room, board and other costs and subtracting financial aid.Note that the net price is typically less than the published for a school. For more information on the sticker price of LCAD, see our tuition and fees and room and board pages.
Almost 66% of college students who graduated with the class of 2018 took out student loans, but that percentage varies from school to school. At LCAD, approximately 40% of students took out student loans averaging $9,655 a year. That adds up to $38,620 over four years for those students.
Get more details about paying for Laguna College of Art and Design.
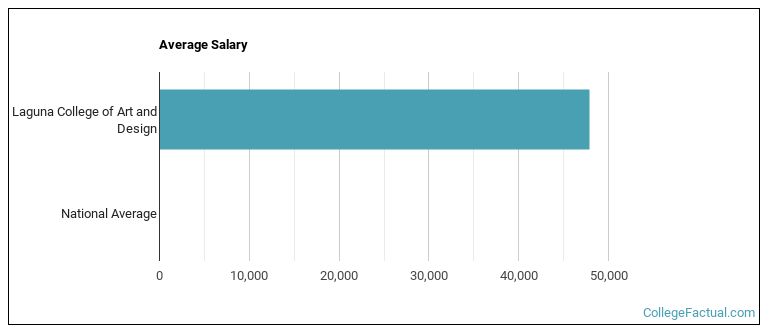
See which majors at Laguna College of Art and Design make the most money.
Get more details about the location of Laguna College of Art and Design.

Contact details for LCAD are given below.
| Contact Details | |
|---|---|
| Address: | 2222 Laguna Canyon Rd, Laguna Beach, CA 92651 |
| Phone: | 949-376-6000 |
| Website: | www.lcad.edu/ |
| Most Popular Majors | Bachelor’s Degrees | Average Salary of Graduates |
|---|---|---|
| Design & Applied Arts | 90 | $27,785 |
| Graphic Communications | 29 | $17,941 |
| Fine & Studio Arts | 13 | $8,482 |
| Writing Studies | 0 | NA |
Online learning options are becoming more and more popular at American colleges and universities. Online classes are great for students who have busy schedules or for those who just want to study on their own time.
In 2022-2023, 492 students took at least one online class at Laguna College of Art and Design. This is a decrease from the 506 students who took online classes the previous year.
| Year | Took at Least One Online Class | Took All Classes Online |
|---|---|---|
| 2022-2023 | 492 | 0 |
| 2021-2022 | 506 | 10 |
| 2020-2021 | 769 | 769 |
| 2018-2019 | 218 | 0 |
Learn more about online learning at Laguna College of Art and Design.
Footnotes
*The racial-ethnic minorities count is calculated by taking the total number of students and subtracting white students, international students, and students whose race/ethnicity was unknown. This number is then divided by the total number of students at the school to obtain the racial-ethnic minorities percentage.
References
More about our data sources and methodologies.