College Factual analyzes over 2,000 colleges and universities in its annual rankings and ranks them in a variety of ways, including most diverse, best overall quality, best for non-traditional students, and much more.
Lower Columbia College was awarded 3 badges in the 2025 rankings. The highest ranked major at the school is nursing.
Explore the best ranked schools for the programs you are most interested in.
College Factual ranked LCC as #1,866 out of 2,152 colleges and universities in the country on its 2025 Best Colleges list. This is an improvement over the previous year, when LCC held the #1,942 spot on the Best Overall Colleges list.
LCC is also ranked #43 out of 50 schools in Washington.
Lower Columbia College has an open admissions policy, so you should not have much trouble being accepted by the school. Still, it is important to fill out the application completely and submit any requested materials, which may include proof that you have a high school diploma or the equivalent.
With a student to faculty ratio of 13 to 1, Lower Columbia College is about average in this regard as the nationwide rate is 15 to 1. While this does not translate directly to class size, it's a good indicator of how much time professors will have to spend with their students on a one-on-one basis.
Another measure that is often used to estimate how much access students will have to their professors is how many faculty members are full-time. The idea here is that part-time faculty tend to spend less time on campus, so they may not be as available to students as full-timers.
The full-time faculty percentage at Lower Columbia College is 92%. This is higher than the national average of 47%.
During the 2017-2018 academic year, there were 2,325 undergraduates at LCC with 1,329 being full-time and 996 being part-time.
| $0-30 K | $30K-48K | $48-75 | $75-110K | $110K + |
|---|---|---|---|---|
| $5,582 | $7,496 | $7,536 | $11,334 | $12,944 |
The net price is calculated by adding tuition, room, board and other costs and subtracting financial aid.Note that the net price is typically less than the published for a school. For more information on the sticker price of LCC, see our tuition and fees and room and board pages.
It's not uncommon for college students to take out loans to pay for school. In fact, almost 66% of students nationwide depend at least partially on loans. At LCC, approximately 13% of students took out student loans averaging $4,983 a year. That adds up to $19,932 over four years for those students.
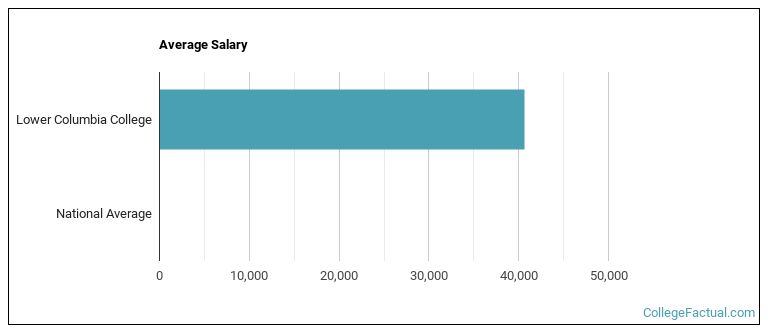
See which majors at Lower Columbia College make the most money.
Get more details about the location of Lower Columbia College.

Contact details for LCC are given below.
| Contact Details | |
|---|---|
| Address: | 1600 Maple Street, Longview, WA 98632 |
| Phone: | 360-442-2311 |
| Website: | https://lowercolumbia.edu/ |
| Most Popular Majors | Bachelor’s Degrees | Average Salary of Graduates |
|---|---|---|
| Liberal Arts General Studies | 277 | NA |
| Nursing | 112 | NA |
| Practical Nursing & Nursing Assistants | 46 | NA |
| Teacher Education Grade Specific | 27 | NA |
| Allied Health & Medical Assisting Services | 21 | NA |
| Health & Medical Administrative Services | 13 | NA |
| General Business/Commerce | 9 | NA |
| Vehicle Maintenance & Repair | 7 | NA |
| General Biology | 6 | NA |
| Business Administration & Management | 6 | NA |
Online learning is becoming popular at even the oldest colleges and universities in the United States. Not only are online classes great for returning adults with busy schedules, they are also frequented by a growing number of traditional students.
In 2022-2023, 1,743 students took at least one online class at Lower Columbia College. This is a decrease from the 1,859 students who took online classes the previous year.
| Year | Took at Least One Online Class | Took All Classes Online |
|---|---|---|
| 2022-2023 | 1,743 | 894 |
| 2021-2022 | 1,859 | 1,166 |
| 2020-2021 | 2,219 | 1,818 |
| 2018-2019 | 1,373 | 612 |
Footnotes
*The racial-ethnic minorities count is calculated by taking the total number of students and subtracting white students, international students, and students whose race/ethnicity was unknown. This number is then divided by the total number of students at the school to obtain the racial-ethnic minorities percentage.
References
More about our data sources and methodologies.