Here is an overview of this program at Manor College. Degrees are awarded at the Bachelor’s, Associate’s levels. Jump to any of the following sections:
The following degree levels are available for health/medical admin services at Manor College, along with how many graduates complete each level annually.
| Degree Level | Annual Graduates |
|---|---|
| Bachelor’s | 5 |
| Associate’s | 2 |
During the most recent reporting year, Manor College awarded 5 bachelor’s degrees in health/medical admin services.
Manor College has not been ranked for health/medical admin services at the bachelor’s level.
Average full-time tuition and fees are listed in the table below.
| In State | Out of State | |
|---|---|---|
| Tuition | $17,780 | $19,990 |
| Fees | $1,790 | $1,790 |
Learn more about Manor College tuition and fees.
For the most recent academic year available, 20% of health/medical admin services bachelor’s degrees went to men and 80% went to women.
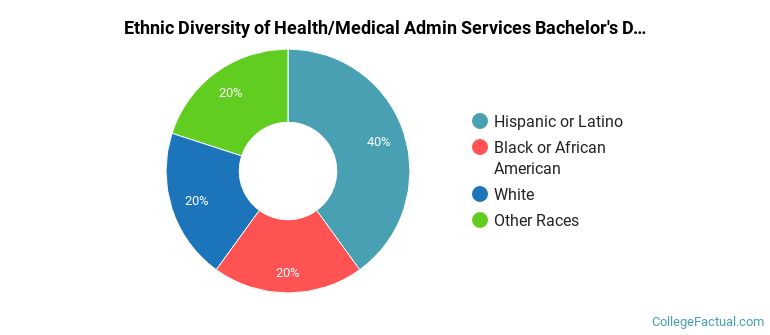
 The majority of health/medical admin services bachelor’s degree graduates at Manor College are Hispanic or Latino. Roughly 40% of graduates fell into this category.
The following table and chart show the ethnic background for students who recently graduated from Manor College with a bachelor’s in health/medical admin services.
| Ethnic Background | Number of Students |
|---|---|
| Asian | 0 |
| Black or African American | 1 |
| Hispanic or Latino | 2 |
| White | 1 |
| Non-Resident Aliens | 0 |
| Other Races | 1 |
Manor College conferred 3 bachelor’s completions in health/health care administration/management recently — 67% to women and 33% to men. The largest share of these graduates were Hispanic or Latino (33%).
Manor College awarded 2 bachelor’s degrees in health and medical administrative services, other in the most recent reporting year — 100% to women and 0% to men. The most common background among these graduates was Black or African American (50%).
For the most recent IPEDS reporting year, Manor College handed out 2 associate’s degrees in health/medical admin services.
Manor College is not currently ranked for health/medical admin services at the associate’s level.
Every one of the 2 students who graduated with a associate’s degree in health/medical admin services from Manor College were women.
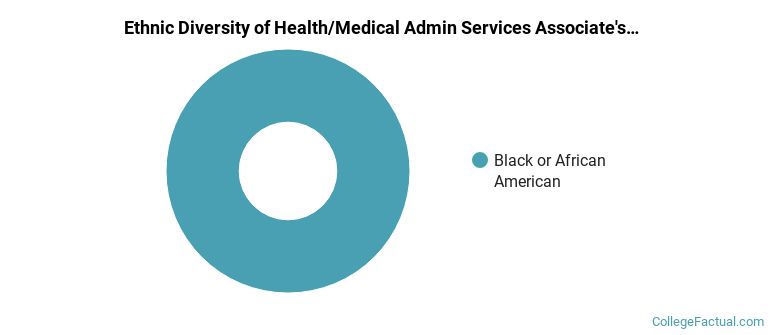
 The majority of health/medical admin services associate’s degree graduates at Manor College are Black or African American. About 100% of graduates fell into this category.
The following table and chart show the ethnic background for students who recently graduated from Manor College with a associate’s in health/medical admin services.
| Ethnic Background | Number of Students |
|---|---|
| Asian | 0 |
| Black or African American | 2 |
| Hispanic or Latino | 0 |
| White | 0 |
| Non-Resident Aliens | 0 |
| Other Races | 0 |
Manor College granted 2 associate’s completions in health/health care administration/management in the most recent reporting year — 100% to women and 0% to men. Most of these graduates identified as Black or African American (100%).
More about our data sources and methodologies.