College Factual recognizes the best colleges and universities in its annual rankings. These rankings include categories for best overall colleges, best colleges for each major, best value schools, and much more.
Massachusetts College of Liberal Arts was awarded 8 badges in the 2025 rankings. The highest ranked major at the school is visual & performing arts.
Explore the best ranked schools for the programs you are most interested in.
According to College Factual's 2025 analysis, MCLA is ranked #1,574 out of 2,152 schools in the nation that were analyzed for overall quality. This is an improvement over the previous year, when MCLA held the #1,643 spot on the Best Overall Colleges list.
See all of the rankings for Massachusetts College of Liberal Arts.
Massachusetts College of Liberal Arts has an acceptance rate of 92%, so it is easier to gain admission to this school than some others. Still, the admissions staff will examine your application closely to make sure you're a good fit for MCLA.
At MCLA, the student to faculty ratio is an excellent 9 to 1. That's much better than the national average of 15 to 1. This indicates that many classes will probably be small, and students will have ample opportunites to work closely with their professors and classmates.
In addition to the student to faculty ratio, some people look at what percentage of faculty members are full-time as a sign of how much time professors will be able to spend with their students. This is because part-time teachers may not be be on campus as much as their full-time counterparts.
The full-time faculty percentage at Massachusetts College of Liberal Arts is 70%. This is higher than the national average of 47%.
The freshmen retention rate tells us what percentage of first-year, full-time students choose to continue on to their sophomore year at a particular school. The rate at Massachusetts College of Liberal Arts is 64%, which is about average when compared to the national rate of 68%.
Students are considered to have graduated on time if they finish their studies within four years. At MCLA the on-time graduation rate of first-time, full-time students is 45%. That is great when compared to the national average of 33.3%
Find out more about the retention and graduation rates at Massachusetts College of Liberal Arts.
During the 2017-2018 academic year, there were 1,076 undergraduates at MCLA with 931 being full-time and 145 being part-time.
| $0-30 K | $30K-48K | $48-75 | $75-110K | $110K + |
|---|---|---|---|---|
| $12,483 | $17,616 | $21,213 | $18,552 | $20,054 |
The net price is calculated by adding tuition, room, board and other costs and subtracting financial aid.Note that the net price is typically less than the published for a school. For more information on the sticker price of MCLA, see our tuition and fees and room and board pages.
Almost 66% of college students who graduated with the class of 2018 took out student loans, but that percentage varies from school to school. At MCLA, approximately 99% of students took out student loans averaging $5,355 a year. That adds up to $21,420 over four years for those students.
Get more details about paying for Massachusetts College of Liberal Arts.
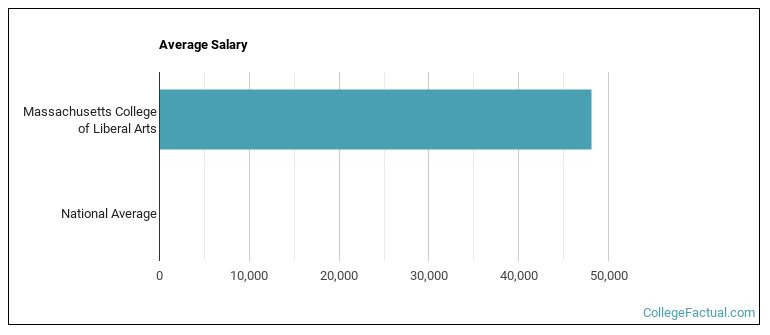
See which majors at Massachusetts College of Liberal Arts make the most money.
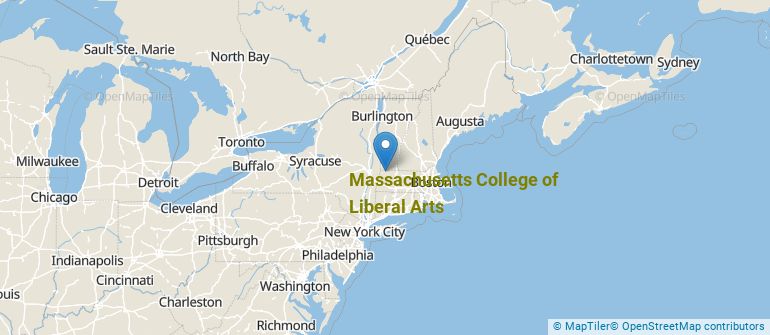
Get more details about the location of Massachusetts College of Liberal Arts.
Contact details for MCLA are given below.
| Contact Details | |
|---|---|
| Address: | 375 Church Street, North Adams, MA 01247-4100 |
| Phone: | 413-662-5000 |
| Website: | https://www.mcla.edu/ |
| Most Popular Majors | Bachelor’s Degrees | Average Salary of Graduates |
|---|---|---|
| General Education | 50 | $39,375 |
| Business Administration & Management | 46 | $39,369 |
| General Psychology | 40 | $32,855 |
| Other Multi/Interdisciplinary Studies | 28 | $35,293 |
| Health Sciences & Services | 24 | NA |
| Sociology | 20 | $38,631 |
| General English Literature | 19 | $29,677 |
| Computer Information Systems | 18 | $80,332 |
| General Visual & Performing Arts | 17 | NA |
| General Biology | 16 | NA |
Online learning options are becoming more and more popular at American colleges and universities. Online classes are great for students who have busy schedules or for those who just want to study on their own time.
In 2022-2023, 283 students took at least one online class at Massachusetts College of Liberal Arts. This is a decrease from the 310 students who took online classes the previous year.
| Year | Took at Least One Online Class | Took All Classes Online |
|---|---|---|
| 2022-2023 | 283 | 78 |
| 2021-2022 | 310 | 40 |
| 2020-2021 | 957 | 80 |
| 2018-2019 | 344 | 100 |
Learn more about online learning at Massachusetts College of Liberal Arts.
If you’re considering Massachusetts College of Liberal Arts, here are some more schools you may be interested in knowing more about.
Curious on how these schools stack up against MCLA? Pit them head to head with College Combat, our free interactive tool that lets you compare college on the features that matter most to you!
Footnotes
*The racial-ethnic minorities count is calculated by taking the total number of students and subtracting white students, international students, and students whose race/ethnicity was unknown. This number is then divided by the total number of students at the school to obtain the racial-ethnic minorities percentage.
References
More about our data sources and methodologies.