Explore the best ranked schools for the programs you are most interested in.
According to College Factual's 2025 analysis, Midland U is ranked #1,449 out of 2,152 schools in the nation that were analyzed for overall quality.
Midland U also holds the #14 spot on the Best Colleges in Nebraska ranking.
Midland University has an acceptance rate of 65%, which means the school is serious about who it admits. Take your time in putting together a strong application that highlights why you are a good fit for Midland U.
About 9% of students accepted to Midland U submitted their SAT scores. When looking at the 25th through the 75th percentile, SAT Evidence-Based Reading and Writing scores ranged between 480 and 610. Math scores were between 470 and 600.
With a student to faculty ratio of 14 to 1, Midland University is about average in this regard as the nationwide rate is 15 to 1. While this does not translate directly to class size, it's a good indicator of how much time professors will have to spend with their students on a one-on-one basis.
Another measure that is often used to estimate how much access students will have to their professors is how many faculty members are full-time. The idea here is that part-time faculty tend to spend less time on campus, so they may not be as available to students as full-timers.
The full-time faculty percentage at Midland University is 100%. This is higher than the national average of 47%.
The freshmen retention rate tells us what percentage of first-year, full-time students choose to continue on to their sophomore year at a particular school. The rate at Midland University is 69%, which is about average when compared to the national rate of 68%.
When it comes to finishing their studies on time, those seeking a bachelor's degree from Midland U have a four-year graduation rate of 37%. This is comparable to the national average of 33.3%
Find out more about the retention and graduation rates at Midland University.
During the 2017-2018 academic year, there were 1,512 undergraduates at Midland U with 1,188 being full-time and 324 being part-time.
| $0-30 K | $30K-48K | $48-75 | $75-110K | $110K + |
|---|---|---|---|---|
| $18,071 | $20,115 | $22,790 | $24,039 | $25,396 |
The net price is calculated by adding tuition, room, board and other costs and subtracting financial aid.Note that the net price is typically less than the published for a school. For more information on the sticker price of Midland U, see our tuition and fees and room and board pages.
It's not uncommon for college students to take out loans to pay for school. In fact, almost 66% of students nationwide depend at least partially on loans. At Midland U, approximately 91% of students took out student loans averaging $6,614 a year. That adds up to $26,456 over four years for those students.
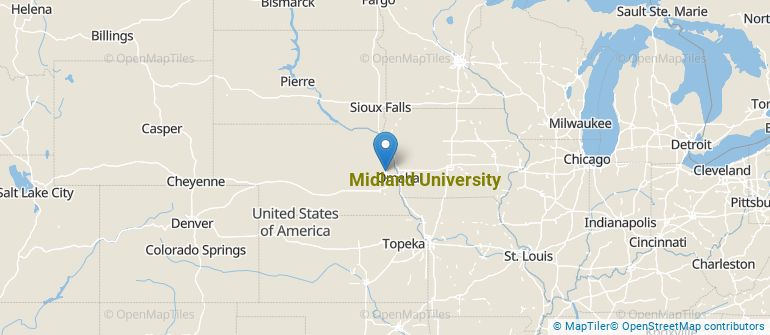
Get more details about the location of Midland University.
Contact details for Midland U are given below.
| Contact Details | |
|---|---|
| Address: | 900 N. Clarkson St., Fremont, NE 68025 |
| Phone: | 800-642-8382 |
| Website: | https://www.midlandu.edu/ |
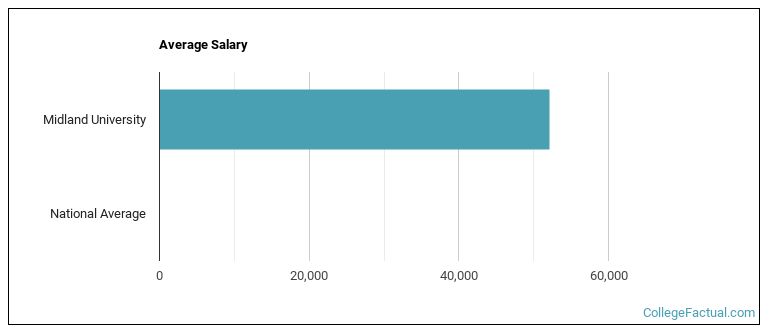
| Most Popular Majors | Bachelor’s Degrees | Average Salary of Graduates |
|---|---|---|
| Business Administration & Management | 59 | NA |
| Teaching English or French | 44 | NA |
| General Education | 36 | $42,394 |
| Health & Physical Education | 29 | $31,475 |
| Educational Administration | 27 | NA |
| Nursing | 26 | $74,515 |
| Criminal Justice & Corrections | 16 | $41,149 |
| Marketing | 12 | NA |
| Accounting | 11 | NA |
| General Business/Commerce | 11 | $44,021 |
Online learning is becoming popular at even the oldest colleges and universities in the United States. Not only are online classes great for returning adults with busy schedules, they are also frequented by a growing number of traditional students.
In 2022-2023, 639 students took at least one online class at Midland University. This is an increase from the 569 students who took online classes the previous year.
| Year | Took at Least One Online Class | Took All Classes Online |
|---|---|---|
| 2022-2023 | 639 | 267 |
| 2021-2022 | 569 | 92 |
| 2020-2021 | 772 | 62 |
| 2018-2019 | 136 | 10 |
Footnotes
*The racial-ethnic minorities count is calculated by taking the total number of students and subtracting white students, international students, and students whose race/ethnicity was unknown. This number is then divided by the total number of students at the school to obtain the racial-ethnic minorities percentage.
References
More about our data sources and methodologies.