Jump to any of the following sections:
The bachelor's program at Monmouth was ranked #366 on College Factual's Best Schools for visual & performing arts list. It is also ranked #11 in New Jersey.
| Ranking Type | Rank |
|---|---|
| Best Visual & Performing Arts Bachelor’s Degree Schools | 321 |
| Best Visual & Performing Arts Schools | 366 |
During the 2021-2022 academic year, Monmouth University handed out 49 bachelor's degrees in visual & performing arts. This is a decrease of 25% over the previous year when 65 degrees were handed out.
During the 2022-2023 academic year, part-time undergraduate students at Monmouth paid an average of $1,276 per credit hour. No discount was available for in-state students. The average full-time tuition and fees for undergraduates are shown in the table below.
| In State | Out of State | |
|---|---|---|
| Tuition | $44,098 | $44,098 |
| Fees | $752 | $752 |
| Books and Supplies | $1,000 | $1,000 |
| On Campus Room and Board | $17,738 | $17,738 |
| On Campus Other Expenses | $4,336 | $4,336 |
Learn more about Monmouth tuition and fees.
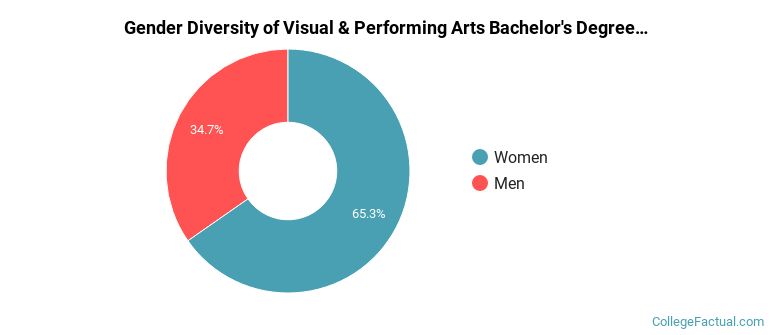
Of the 49 students who graduated with a Bachelor’s in visual & performing arts from Monmouth in 2022, 35% were men and 65% were women.
The majority of the students with this major are white. About 63% of 2022 graduates were in this category.
The following table and chart show the ethnic background for students who recently graduated from Monmouth University with a bachelor's in visual & performing arts.
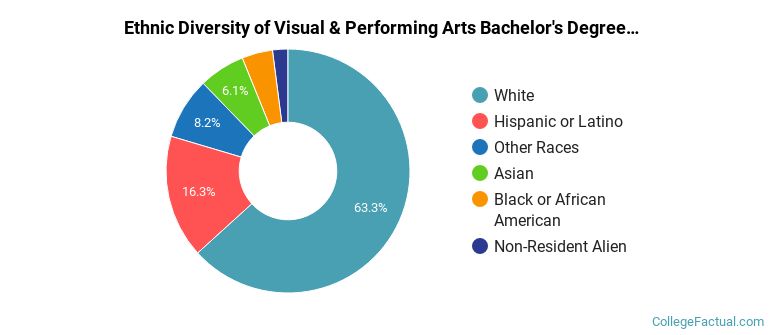
| Ethnic Background | Number of Students |
|---|---|
| Asian | 3 |
| Black or African American | 2 |
| Hispanic or Latino | 8 |
| White | 31 |
| Non-Resident Aliens | 1 |
| Other Races | 4 |
Online degrees for the Monmouth visual & performing arts bachelor’s degree program are not available at this time. To see if the school offers distance learning options in other areas, visit the Monmouth Online Learning page.
Take a look at the following statistics related to the make-up of the visual & performing arts majors at Monmouth University.
Visual & Performing Arts students may decide to major in one of the following focus areas. Individual majors may not be available for all degree levels.
| Major | Annual Graduates |
|---|---|
| Music | 26 |
| Design & Applied Arts | 19 |
| Fine & Studio Arts | 4 |
More about our data sources and methodologies.