We've gathered data and other essential information about the program, such as the ethnicity of students, how many students graduated in recent times, and more. In addition, we cover how UMO ranks in comparison to other schools with health science programs.
Jump to any of the following sections:
The health science major at UMO is not ranked on College Factual’s Best Colleges and Universities for Health Sciences & Services. This could be for a number of reasons, such as not having enough data on the major or school to make an accurate assessment of its quality.
In 2022-2023, the average part-time undergraduate tuition at UMO was $455 per credit hour for both in-state and out-of-state students. The average full-time tuition and fees for undergraduates are shown in the table below.
| In State | Out of State | |
|---|---|---|
| Tuition | $24,850 | $24,850 |
| Fees | $1,100 | $1,100 |
| Books and Supplies | $1,350 | $1,350 |
| On Campus Room and Board | $11,212 | $11,212 |
| On Campus Other Expenses | $2,000 | $2,000 |
Learn more about UMO tuition and fees.
UMO does not offer an online option for its health science bachelor’s degree program at this time. To see if the school offers distance learning options in other areas, visit the UMO Online Learning page.
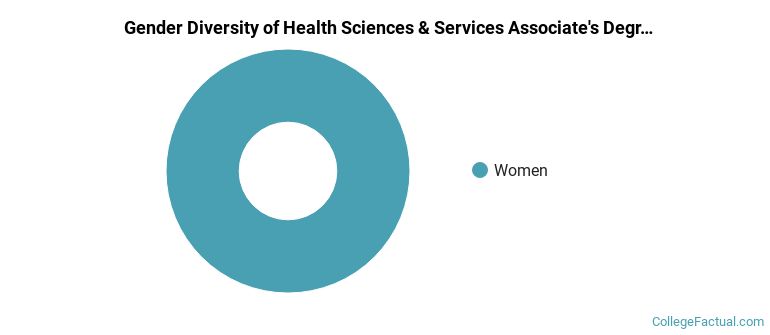
All of the 4 students who graduated with a Associate’s in health science from UMO in 2022 were women.
The following table and chart show the ethnic background for students who recently graduated from University of Mount Olive with a associate's in health science.
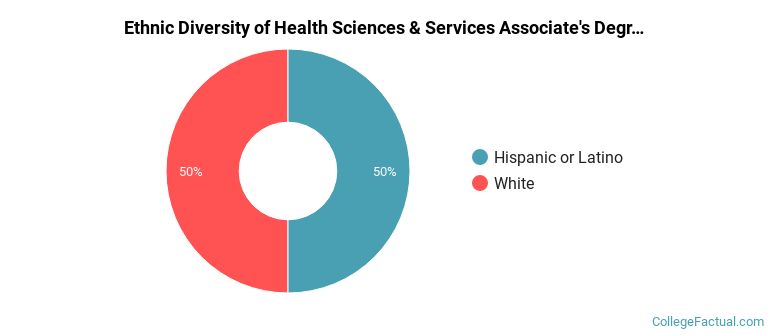
| Ethnic Background | Number of Students |
|---|---|
| Asian | 0 |
| Black or African American | 0 |
| Hispanic or Latino | 2 |
| White | 2 |
| Non-Resident Aliens | 0 |
| Other Races | 0 |
| Related Major | Annual Graduates |
|---|---|
| Health & Medical Administrative Services | 42 |
| Nursing | 25 |
More about our data sources and methodologies.