Here is an overview of this program at NSU. Degrees are awarded at the Bachelor’s level, with graduate study also available. At its best it places at #5 out of 11 schools (Bachelor’s level) by College Factual. Jump to any of the following sections:
College Factual ranks NSU as a strong choice for teacher education subject specific, coming in at #409 out of 554 schools nationally.
The following degree levels are granted in teacher education subject specific at NSU, along with how many graduates complete each level annually.
| Degree Level | Annual Graduates |
|---|---|
| Bachelor’s | 36 |
| Master’s | 25 |
| Graduate Certificate | 11 |
During the most recent reporting year, Northeastern State University awarded 36 bachelor’s degrees in teacher education subject specific.
NSU holds a strong position among schools offering teacher education subject specific at the bachelor’s level. In particular it placed #5 out of 11 schools by College Factual.
Teacher Education Subject Specific majors who earn their bachelor’s degree from NSU earn a median of $46,418 a year. This is lower than $55,657, the median for all majors at NSU.
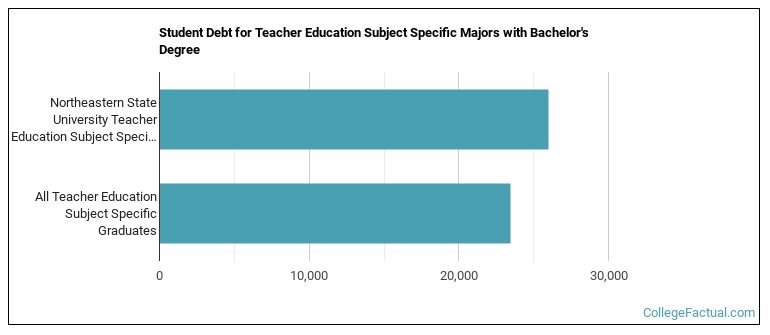
To complete a bachelor’s at NSU, teacher education subject specific graduates take on a median debt of $26,000 in student loans. This is higher than $23,465, the typical median for all majors at NSU.
Average full-time tuition and fees are listed in the table below.
| In State | Out of State | |
|---|---|---|
| Tuition | $6,000 | $16,400 |
| Fees | $890 | $890 |
Learn more about NSU tuition and fees.
For the most recent academic year available, 50% of teacher education subject specific bachelor’s degrees went to men and 50% went to women.
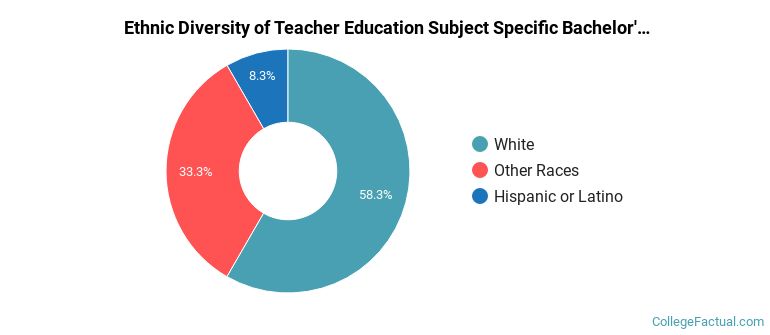
 The largest share of teacher education subject specific bachelor’s degree graduates at NSU are White. Roughly 58% of graduates fell into this category.
The following table and chart show the ethnic background for students who recently graduated from Northeastern State University with a bachelor’s in teacher education subject specific.
| Ethnic Background | Number of Students |
|---|---|
| Asian | 0 |
| Black or African American | 0 |
| Hispanic or Latino | 3 |
| White | 21 |
| Non-Resident Aliens | 0 |
| Other Races | 12 |
NSU conferred 10 bachelor’s completions in social studies teacher education in the most recent reporting year — 40% to women and 60% to men. The most common background among these graduates was White (70%).
NSU awarded 9 bachelor’s completions in physical education teaching and coaching in the most recent reporting year — 22% to women and 78% to men. The most common background among these graduates was White (67%).
NSU conferred 7 bachelor’s degrees in english/language arts teacher education in the latest year of data — 86% to women and 14% to men. The largest share of these graduates were White (43%).
NSU awarded 5 bachelor’s completions in music teacher education in the latest year of data — 40% to women and 60% to men. Most of these graduates identified as White (40%).
NSU awarded 2 bachelor’s completions in art teacher education in the most recent reporting year — 100% to women and 0% to men. The most common background among these graduates was White (50%).
NSU conferred 2 bachelor’s completions in mathematics teacher education in the most recent reporting year — 50% to women and 50% to men. Most of these graduates identified as White (50%).
NSU granted 1 bachelor’s degree in science teacher education/general science teacher education in the latest year of data — 100% to women and 0% to men. The largest share of these graduates were White (100%).
This program is also offered at the graduate level at NSU. Here are the graduate award levels offered.
| Graduate Level | Annual Graduates |
|---|---|
| Master’s Degrees in Teacher Education Subject Specific | 25 |
| Graduate Certificate Degrees in Teacher Education Subject Specific | 11 |
