We’ve pulled together the essential facts you should know about the program at Northwestern University. Degrees are awarded at the Bachelor’s level, with graduate study also available. It ranks as high as #1 out of 47 schools (Bachelor’s level) by College Factual. Jump to any of the following sections:
College Factual rates Northwestern University among the top schools in the country for drama & theater arts, ranked #2 out of 359 schools nationally.
| Ranking | Rank |
|---|---|
| Best Drama & Theater Arts Schools | 2 of 359 |
| Best Drama & Theater Arts Schools in Illinois | 1 of 15 |
| Best Drama & Theater Arts Schools in the Great Lakes Region | 1 of 48 |
The table below lists every degree level available for drama & theater arts at Northwestern University, along with how many graduates complete each level annually.
| Degree Level | Annual Graduates |
|---|---|
| Bachelor’s | 91 |
| Master’s | 16 |
| Doctoral | 5 |
For the most recent IPEDS reporting year, Northwestern University awarded 91 bachelor’s degrees in drama & theater arts.
Northwestern University is among the very best schools in the country for drama & theater arts at the bachelor’s level. In particular it placed #1 out of 47 schools by College Factual.
Drama & Theater Arts graduates with a bachelor’s degree from Northwestern University report a median salary of $36,466 a year. This is below $111,206, the median for all majors at Northwestern University.
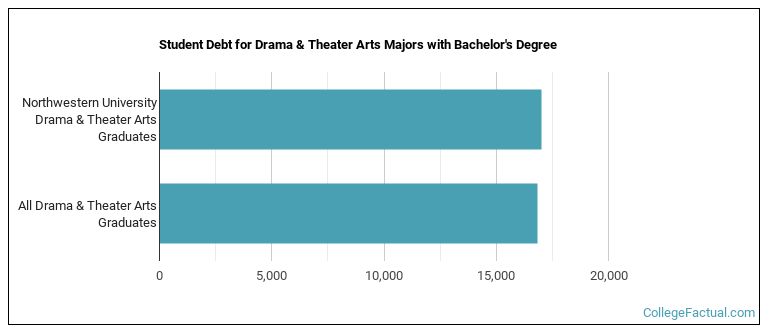
While getting their bachelor’s degree at Northwestern University, drama & theater arts students accumulate a median of $17,000 in student loans. This is above $16,857, the typical median for all majors at Northwestern University.
The full-time undergraduate tuition and fees are shown below.
| In State | Out of State | |
|---|---|---|
| Tuition | $60,276 | $67,158 |
| Fees | $1,164 | $1,164 |
Find out more about Northwestern University tuition and fees.
Among recent graduates, 35% of drama & theater arts bachelor’s degrees went to men and 65% went to women.
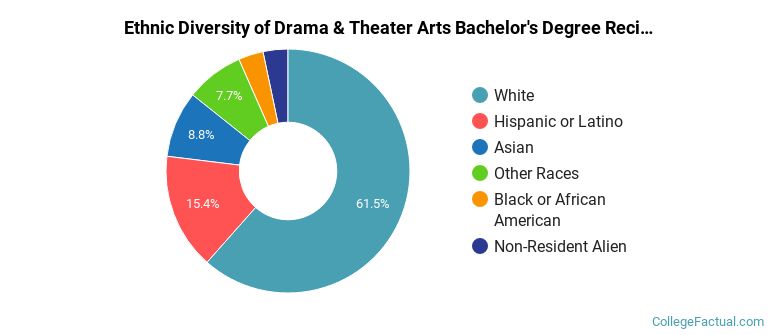
 The largest share of drama & theater arts bachelor’s degree graduates at Northwestern University were White. About 62% of graduates fell into this category.
The following table and chart show the ethnic background for students who recently graduated from Northwestern University with a bachelor’s in drama & theater arts.
| Ethnic Background | Number of Students |
|---|---|
| Asian | 8 |
| Black or African American | 3 |
| Hispanic or Latino | 14 |
| White | 56 |
| Non-Resident Aliens | 3 |
| Other Races | 7 |
Northwestern University conferred 91 bachelor’s completions in drama and dramatics/theatre arts, general in the latest year of data — 65% to women and 35% to men. The largest share of these graduates were White (62%).
This program is also offered at the graduate level at Northwestern University. Here are the graduate award levels offered.
| Graduate Level | Annual Graduates |
|---|---|
| Master’s Degrees in Drama & Theater Arts | 16 |
| Doctoral Degrees in Drama & Theater Arts | 5 |
