Here, you'll find out more about the major, including such details as the number of graduates, what degree levels are offered, ethnicity of students, average salaries, and more. In addition, we cover how Oakland ranks in comparison to other schools with political science programs.
Jump to any of the following sections:
Learn about start dates, transferring credits, availability of financial aid, and more by contacting the universities below.
Gain a solid understanding of American political history, the current political landscape, and the major political parties with this online bachelor's from Southern New Hampshire University.
The bachelor's program at Oakland was ranked #472 on College Factual's Best Schools for political science list. It is also ranked #11 in Michigan.
| Ranking Type | Rank |
|---|---|
| Best Political Science & Government Bachelor’s Degree Schools | 460 |
| Best Political Science & Government Schools | 472 |
During the 2021-2022 academic year, Oakland University handed out 40 bachelor's degrees in political science & government. This is a decrease of 9% over the previous year when 44 degrees were handed out.
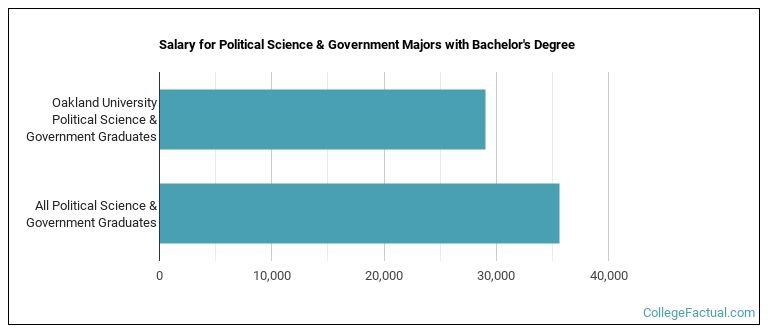
The median salary of political science students who receive their bachelor's degree at Oakland is $29,080. Unfortunately, this is lower than the national average of $35,631 for all political science students.
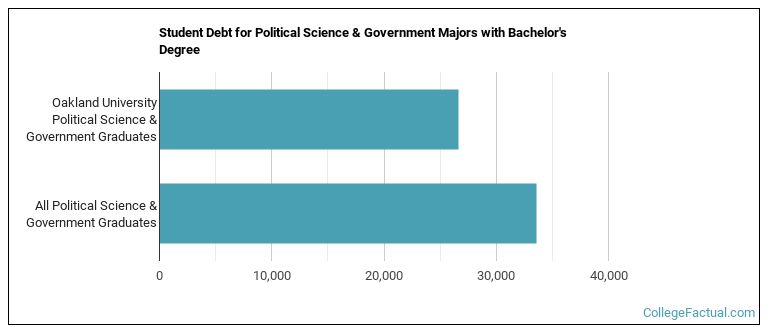
While getting their bachelor's degree at Oakland, political science students borrow a median amount of $26,607 in student loans. This is not too bad considering that the median debt load of all political science bachelor's degree recipients across the country is $33,583.
During the 2022-2023 academic year, part-time undergraduate students at Oakland paid an average of $825 per credit hour if they came to the school from out-of-state. In-state students paid a discounted rate of $548 per credit hour. The following table shows the average full-time tuition and fees for undergraduates.
| In State | Out of State | |
|---|---|---|
| Tuition | $16,429 | $24,737 |
| Books and Supplies | $700 | $700 |
| On Campus Room and Board | $11,309 | $11,309 |
| On Campus Other Expenses | $2,600 | $2,600 |
Learn more about Oakland tuition and fees.
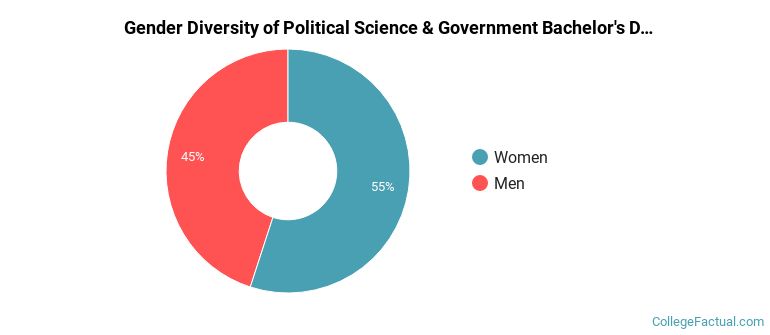
In the 2021-2022 academic year, 40 students earned a bachelor's degree in political science from Oakland. About 55% of these graduates were women and the other 45% were men.
The majority of the students with this major are white. About 75% of 2022 graduates were in this category.
The following table and chart show the ethnic background for students who recently graduated from Oakland University with a bachelor's in political science.
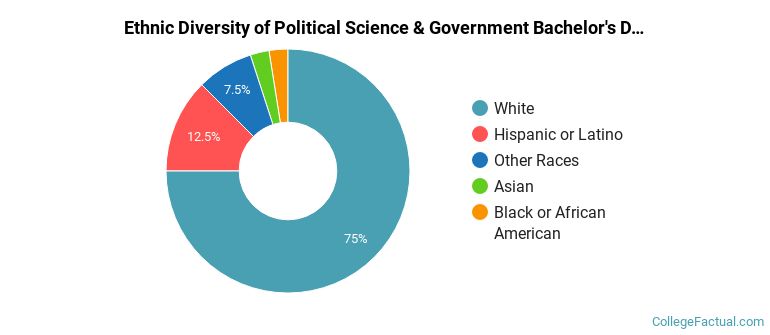
| Ethnic Background | Number of Students |
|---|---|
| Asian | 1 |
| Black or African American | 1 |
| Hispanic or Latino | 5 |
| White | 30 |
| Non-Resident Aliens | 0 |
| Other Races | 3 |
Oakland does not offer an online option for its political science bachelor’s degree program at this time. To see if the school offers distance learning options in other areas, visit the Oakland Online Learning page.
Take a look at the following statistics related to the make-up of the political science majors at Oakland University.
| Related Major | Annual Graduates |
|---|---|
| Sociology | 24 |
| International Relations & National Security | 13 |
| Anthropology | 9 |
| Economics | 6 |
More about our data sources and methodologies.
