We’ve pulled together the essential facts you should know about the program at OU. It is offered at the Bachelor’s level. Jump to any of the following sections:
The table below lists every degree level offered in health/medical prep programs at OU, along with how many graduates complete each level annually.
| Degree Level | Annual Graduates |
|---|---|
| Bachelor’s | 10 |
In the most recent year for which we have data, Oakwood University awarded 10 bachelor’s degrees in health/medical prep programs.
OU is not currently ranked for health/medical prep programs at the bachelor’s level.
Average full-time tuition and fees are listed in the table below.
| In State | Out of State | |
|---|---|---|
| Tuition | $18,974 | $21,344 |
| Fees | $1,168 | $1,168 |
Read more about OU tuition and fees.
For the most recent academic year available, 20% of health/medical prep programs bachelor’s degrees went to men and 80% went to women.
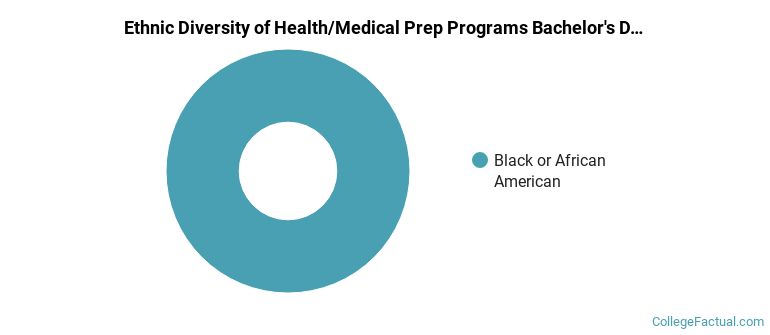
 The majority of health/medical prep programs bachelor’s degree graduates at OU are Black or African American. Approximately 100% of graduates fell into this category.
The following table and chart show the ethnic background for students who recently graduated from Oakwood University with a bachelor’s in health/medical prep programs.
| Ethnic Background | Number of Students |
|---|---|
| Asian | 0 |
| Black or African American | 10 |
| Hispanic or Latino | 0 |
| White | 0 |
| Non-Resident Aliens | 0 |
| Other Races | 0 |
OU conferred 8 bachelor’s completions in pre-physical therapy studies in the latest year of data — 75% to women and 25% to men. Most of these graduates identified as Black or African American (100%).
OU conferred 2 bachelor’s degrees in pre-occupational therapy studies recently — 100% to women and 0% to men. Most of these graduates identified as Black or African American (100%).
More about our data sources and methodologies.