We've pulled together some essential information you should know about the program, including how many students graduate each year, the ethnic diversity of these students, average starting salaries, and more. In addition, we cover how Paul Smith's College ranks in comparison to other schools with culinary arts programs.
Go directly to any of the following sections:
The culinary arts major at Paul Smith's College is not ranked on College Factual’s Best Colleges and Universities for Culinary Arts. This could be for a number of reasons, such as not having enough data on the major or school to make an accurate assessment of its quality.
During the 2021-2022 academic year, Paul Smiths College of Arts and Science handed out 9 bachelor's degrees in culinary arts. This is a decrease of 25% over the previous year when 12 degrees were handed out.
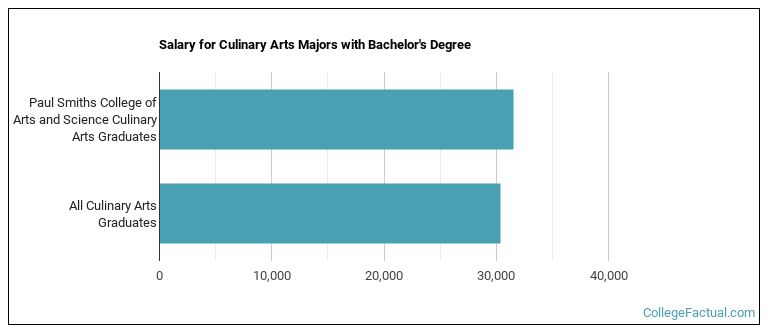
The median salary of culinary arts students who receive their bachelor's degree at Paul Smith's College is $31,506. This is higher than $30,409, which is the national median for all culinary arts bachelor's degree recipients.
During the 2022-2023 academic year, part-time undergraduate students at Paul Smith’s College paid an average of $1,067 per credit hour. No discount was available for in-state students. Information about average full-time undergraduate tuition and fees is shown in the table below.
| In State | Out of State | |
|---|---|---|
| Tuition | $32,012 | $32,012 |
| Fees | $37 | $37 |
| Books and Supplies | $1,000 | $1,000 |
| On Campus Room and Board | $16,106 | $16,106 |
| On Campus Other Expenses | $2,500 | $2,500 |
Learn more about Paul Smith’s College tuition and fees.
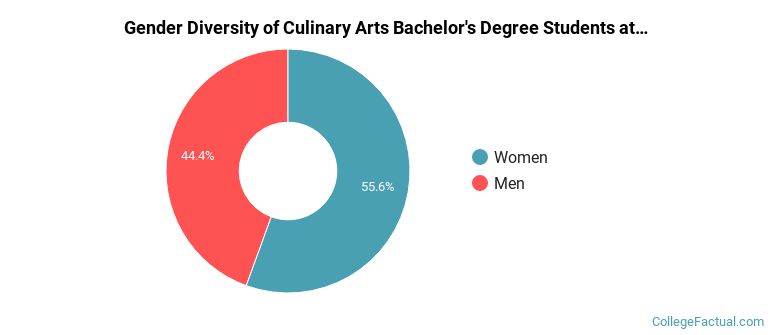
During the 2021-2022 academic year, 9 culinary arts majors earned their bachelor's degree from Paul Smith's College. Of these graduates, 44% were men and 56% were women.
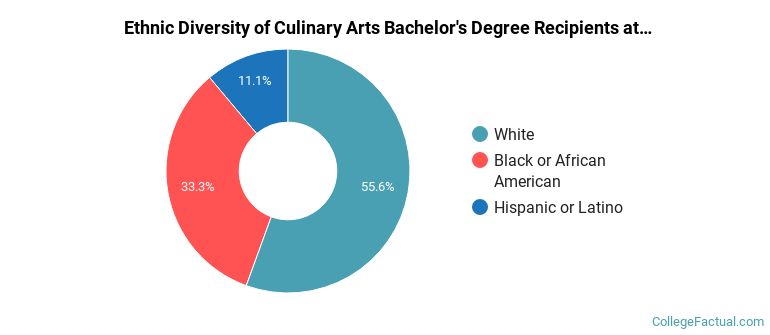
The majority of the students with this major are white. About 56% of 2022 graduates were in this category.
The following table and chart show the ethnic background for students who recently graduated from Paul Smiths College of Arts and Science with a bachelor's in culinary arts.
| Ethnic Background | Number of Students |
|---|---|
| Asian | 0 |
| Black or African American | 3 |
| Hispanic or Latino | 1 |
| White | 5 |
| Non-Resident Aliens | 0 |
| Other Races | 0 |
Paul Smith’s College does not offer an online option for its culinary arts bachelor’s degree program at this time. To see if the school offers distance learning options in other areas, visit the Paul Smith’s College Online Learning page.
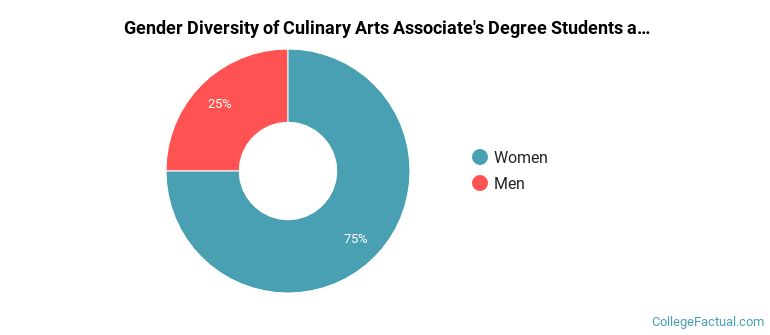
The culinary arts program at Paul Smith's College awarded 4 associate's degrees in 2021-2022. About 25% of these degrees went to men with the other 75% going to women.
The majority of the students with this major are white. About 75% of 2022 graduates were in this category.
The following table and chart show the ethnic background for students who recently graduated from Paul Smiths College of Arts and Science with a associate's in culinary arts.
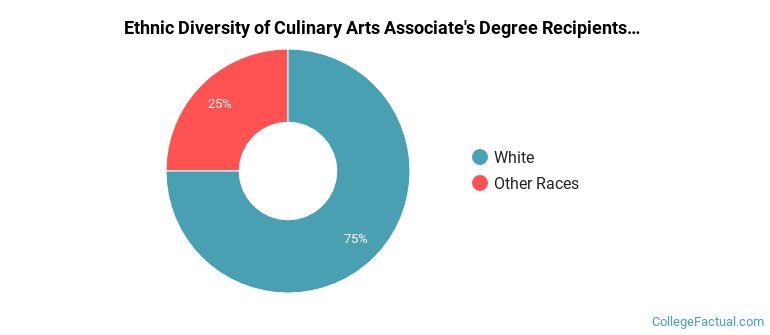
| Ethnic Background | Number of Students |
|---|---|
| Asian | 0 |
| Black or African American | 0 |
| Hispanic or Latino | 0 |
| White | 3 |
| Non-Resident Aliens | 0 |
| Other Races | 1 |
Take a look at the following statistics related to the make-up of the culinary arts majors at Paul Smiths College of Arts and Science.
More about our data sources and methodologies.